Which boundary file to use
The three kinds of boundary file the application accepts, what each one carries, and how the Input Boundary File card on the Site tab reads them.
Every design starts from one file that says where the plant goes. The application accepts three kinds of file: a Google Earth file, a CAD drawing, or a raster image with the boundary drawn on it. All three produce a layout. They differ in how much of the site they carry with them — and therefore in how much work is left for you to do by hand afterwards.
Prepare a Google Earth file. It is the only input that carries the plant boundary, the water bodies, the obstructions and the transmission lines together in one file, already positioned on the earth. A CAD drawing and a raster image carry geometry and nothing else.
The three input types
| Input | What it carries | Obstructions come across automatically | Energy can be calculated with no extra input | Choose it when |
|---|---|---|---|---|
Google Earth file (.kmz, .kml) | The plant boundary — or several, for a multi-plot site — plus water bodies, buildings and other obstructions, and transmission lines, canals and roads. Positioned on the earth, so the site's latitude and longitude are already known. | Yes | Yes | Always, unless you have no way to produce one. |
CAD drawing (.dxf, .dwg) | The boundary outline and any interior obstacles drawn as closed shapes. No geographic position. | Only the closed shapes; nothing is identified as water | No — you must type the site latitude and longitude | The survey exists only as a drawing and redrawing the boundary in Google Earth is not practical. |
Raster image (.jpg, .png, and the other formats below) | One boundary outline, traced from the image at a scale you state. No geographic position. | No | No — you must type the site latitude and longitude | All you have is a scan, a screenshot or an exported picture of the site plan. |
Why a Google Earth file
Four things follow from the file being a Google Earth file, and only from that:
- The site features come with the boundary. Water bodies, buildings, substations, transmission lines, canals and roads that you have drawn inside the boundary are read from the same file and kept clear of module tables. The application decides which is which from the name of each feature, so the naming rules matter — see Boundary file requirements.
- The latitude is known. Latitude drives the automatic tilt angle and the automatic row pitch, and the latitude and longitude are what the weather service is queried with. Nothing has to be typed in for the energy estimate to run.
- Several plots can be laid out in one run. Put every plant boundary in the one file and each becomes its own plant, with its own column in the Summary view. See Multi-plot sites.
- The result goes back where it came from. The finished layout exports as a Google Earth file you can open beside the input. See Google Earth export.
What the other two inputs cost you
- The geographic position has to be typed in. A CAD drawing and an image carry no coordinates. Choosing one opens the Site reference window, which asks for the site latitude and longitude, and if you continue without them the layout is still generated geometrically but energy calculation is unavailable.
- Nothing is identified by name. Water bodies cannot be distinguished from any other closed shape, so a pond is treated as a plain obstruction.
- Line features and setbacks are yours to add. Transmission line and canal corridors are drawn and buffered from line features in a Google Earth file. With the other two inputs you draw the equivalent exclusions by hand in Sketch Mode. See Obstructions and exclusions.
Accepted file extensions
The Select boundary file dialog accepts, under its Boundary Files filter:
| Kind | Extensions |
|---|---|
| Google Earth | .kmz .kml |
| CAD drawing | .dxf .dwg |
| Raster image | .jpg .jpeg .png .gif .bmp .tif .tiff |
A .dwg file needs the free ODA File Converter installed; without it, save
the drawing as .dxf instead. The supported-formats line on the card says the
same when you hover over it.
Loading the file
The Input Boundary File card is the first card on the Site tab, directly under the pinned Generate Layout button. It holds a read-only path field with the placeholder Select a boundary file…, a Browse… button and a round ⓘ button. Under the field a line reads Supported formats: KMZ, KML, DXF, DWG, JPG, PNG, GIF, BMP, TIFF, and while the field is still empty it carries an Open sample site link. Where the card sits in the window is described on The main window.
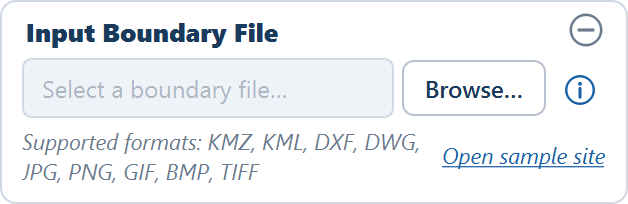
Click Browse…
The path field cannot be typed into — it reports the file in use — so Browse… is the only way to choose one. Pick any of the extensions above; the application works out which kind of file it is from the extension.
Answer the question the file type raises
A CAD drawing opens the Site reference window asking for the site latitude and longitude. An image opens the same window with a SCALE card first, asking how a distance on site maps to a distance on the drawing. A Google Earth file asks nothing, because it already carries its position — unless one of its boundary rings is not closed, in which case the Check boundaries window opens. See Boundary file requirements.
Read the summary line
Once the file is read, the line under the field changes from the list of formats to a summary of what was found — for the sample site, 1 boundary · 1 obstacle · 1 line obstruction — and Generate Layout becomes available. Load a different file at any time and the next Generate Layout uses it.
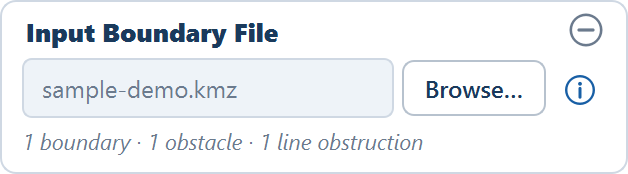
The sample site
Open sample site on the card — or File ▸ Open Sample Site from the menu bar — loads the bundled sample: one boundary with a pond, a transmission line and an obstruction inside it. It is the quickest way to see every kind of feature read and laid out before you prepare your own file, and it is the site Your first layout walks through.
The ⓘ button
The ⓘ button beside Browse… — its tooltip reads Open the boundary file preparation guide — opens the KMZ File Preparation Guide: the rules for boundaries, water bodies, transmission lines and obstructions, ending in a quick-reference table of what must be a polygon, what must be a line, and how each must be named. It is the same material as Boundary file requirements, available without leaving the application; that page also notes the two places where the guide's fixed text lags behind the application.
What happens when the file is read
Every feature in the file must lie inside a plant boundary. An obstruction drawn outside the boundary is not subtracted from anything, so tables are placed straight over the ground you meant to keep clear.
In order:
- The boundaries are read, along with the obstacles and line features contained in each one.
- Latitude and longitude are converted to metres in the site's local UTM zone. All internal geometry is in metres from that point on.
- The boundary is shrunk inward by the Perimeter road width to give the usable area.
- Obstructions, water bodies and the buffered line corridors are subtracted from it, followed by any excluded terrain.
Module tables are then placed only where they fit entirely inside what is left. See How placement works.
Where to go next
Views, layers and tools
The five views of the plant, the tools beside the view tabs, the Layers popover, the plant chips, and the Summary and Energy views.
Boundary file requirements
How to draw and name the features in a Google Earth file so the application reads the boundary, water bodies, obstructions and transmission lines correctly.