Topography
Keeping tables off ground that is inside the boundary but too steep, too uneven or too low-lying to carry a structure.
Topography (slope-aware exclusion) keeps tables off ground that lies inside the boundary but cannot carry them. On sloping ground the two are not the same thing: a stretch of hillside can be clear of every obstruction and still be unbuildable — the pitch direction runs the wrong way, the cross-fall twists the torque tube, or the ground drops so far under one table that the piles cannot make up the difference. The card measures the ground against limits you set and excludes what fails, so those tables are never placed in the first place.
It changes the usable area, exactly as the perimeter road and the obstructions do. The excluded ground is subtracted before the table grid is laid out, and the capacity, module count and bill of materials all report the smaller figure.
The card is the last one on the Site tab.
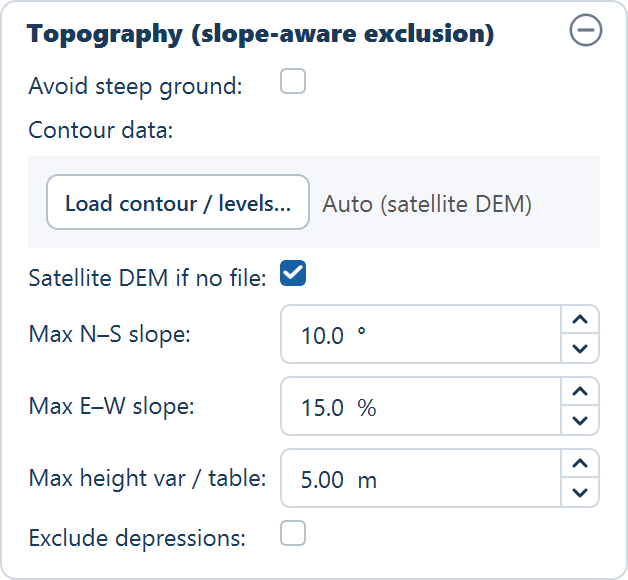
Nothing on this card is kept in a project file — not the tick, not the limits, not the path of a contour file. The terrain result itself is saved with the layout, so a reopened project still shows its contours and exclusions, but the card comes back at the defaults below. Set it again before you generate.
Turning it on
| Field | Default | Range | What it does |
|---|---|---|---|
| Avoid steep ground | off | — | Enables the whole card. With it off, no elevation data is read and nothing is excluded for slope or relief. |
Off by default, and deliberately so: an elevation model costs time to fetch or read, and on genuinely flat ground it changes nothing. Turn it on when the site has real relief — a site you would walk before believing a contour drawing.
The rest of the card is inactive until this is ticked.
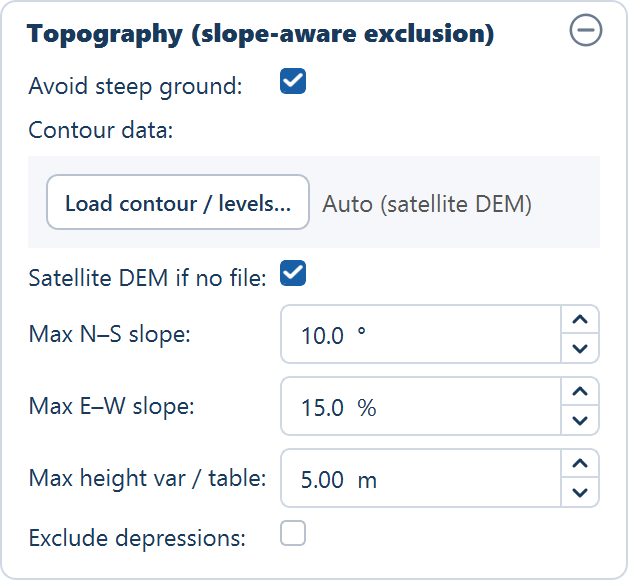
Terrain exclusions are applied after the perimeter road band, the water bodies, the corridors and the obstructions have been taken out, and before any table is placed. So the ground these limits reject is ground that would otherwise have carried modules, and every figure the run reports already has it removed.
Setting it up
Tick Avoid steep ground
Nothing else on the card responds until you do.
Point at a survey file, or leave the automatic fetch on
Click Load contour / levels… and pick a contour or spot-level file if you have one — it is the more accurate of the two sources by a wide margin. With no file, the label beside the button reads Auto (satellite DEM); leave Satellite DEM if no file ticked and make sure the machine is online.
Set the three limits from your own design
The north–south slope limit follows from your row spacing, the east–west limit from what the racking tolerates across a table, and the relief limit from your pile reveals. Defaults are a starting point, not a recommendation.
Decide whether depressions matter on this site
Tick Exclude depressions if standing water is a design case here. It is off unless you ask for it.
Generate, then read the excluded area
Generate the layout, open Layers ▾ above the plot, and switch the Contour / terrain row on to see the contours and the excluded ground against the array. The row's readout gives the reduced-level range and the excluded area.
Where the elevation data comes from
There are two sources. A file you supply takes precedence; the automatic fetch is the fallback.
| Field | Default | Range | What it does |
|---|---|---|---|
| Contour data | Auto (satellite DEM), with a Load contour / levels… button | — | The contour or spot-level file to read heights from. Leave it unset to use the automatic fetch. |
| Satellite DEM if no file | on | — | When no file is supplied, builds the elevation model from public satellite elevation data. Needs an internet connection. |
A file you supply
Use this whenever you have a survey. It is the only way to get the accuracy a detailed design needs, and it is the only source that reflects work already done on the ground.
Load contour / levels… opens the Select contour / spot-level file
dialog, which accepts .dxf, .dwg, .csv and .txt. Two shapes of data
are read:
- A CAD contour file. Contour lines or spot levels, drawn in the project's own coordinate system — the site's local UTM zone, in metres. This is the same projection the layout works in internally, so a drawing taken straight from a surveyor's file registers against the boundary without any further alignment. A drawing in an arbitrary local grid, or in a national grid, does not: shift it into the project's coordinates before loading it. If your boundary came from a CAD drawing rather than a mapping file, see CAD drawing boundaries for how the site is positioned.
- A comma-separated file of longitude, latitude and elevation — one point per line. This is the shape a GPS survey, a drone photogrammetry export or a spot-level schedule usually comes in, and because it carries coordinates in degrees it needs no projection work from you.
Automatic satellite elevation data
With no file supplied and Satellite DEM if no file left on, heights come from public satellite elevation data (SRTM). This needs an internet connection, and it is the only part of this card that reaches outside your machine.
It is a screening tool, not a survey. It is right for the question does this site have a slope problem at all, and roughly where? — early feasibility, a first pass on a site you have not visited, a sanity check on a boundary someone has sent you. It is not right for issuing a pile schedule from.
The three limits
Three separate tests are applied to the ground under each candidate table. Ground failing any of them is excluded.
| Field | Default | Range | What it does |
|---|---|---|---|
| Max N–S slope | 10.0° | 0.0–45.0° | The steepest north–south slope, along the pitch direction, a table may stand on. |
| Max E–W slope | 15.0 % | 0.0–100.0 % | The steepest east–west slope, across the table, that is allowed. |
| Max height var / table | 5.0 m | 0.0–30.0 m | The greatest ground relief allowed inside a single table footprint. |
Maximum north–south slope
Set in degrees, and measured along the direction the rows step back from one another — the pitch direction. This is the slope that fights the array's own geometry. A slope falling away from the equator adds to the effective tilt and lengthens every shadow the row in front casts; a slope rising toward the equator does the reverse and shortens the pitch you could have used. Either way, past some angle the row-to-row geometry the layout assumes no longer holds, and the tables sitting there are not the tables you designed.
Lower this limit and more of a hillside is excluded. Raise it and you are accepting a steeper pitch-direction slope than the flat-ground row spacing was derived for.
Maximum east–west slope
Set as a percentage, and measured across the table — the direction the table's own width runs. This is the cross-fall a single structure has to absorb along its length. It is what decides whether a table can be built level at all without an unreasonable spread of pile reveals across its width, and on a tracker it is what twists the torque tube.
The two limits use different units because that is how the two constraints are conventionally quoted: degrees along the slope you are designing the row spacing against, percent across the structure you are asking the steelwork to tolerate. Watch the units when you compare the two figures: a slope of 15 % is a rise of 15 in 100, which as an angle is well under 15°.
Maximum ground relief within one table
This is the pile-reveal differential: the height difference the foundations under a single table would have to make up. The ground under one table footprint is checked from its lowest point to its highest, and if that difference exceeds the limit, the ground is excluded.
It catches what the two slope limits miss. A footprint can pass both — a modest average slope in each direction — and still cross a bund, a gully or a terrace edge, where the ground is not a plane at all. The relief test looks only at the range, so it fails that footprint regardless of how gentle the average gradient across it works out to be.
Set it from what your foundation design can actually take: the longest pile you will drive against the shortest reveal you will accept. Set it too generously and you will place tables the civil contractor comes back on.
Depressions and water-pooling ground
| Field | Default | Range | What it does |
|---|---|---|---|
| Exclude depressions | off | — | Also excludes low-lying ground where water would collect, on top of the slope tests. |
Off by default. The three limits above ask whether the ground is too steep or too uneven. This asks the opposite question: whether it is too low — a hollow with no outfall, where water collects after rain and stands.
Turn it on for a site with visible depressions, on black cotton soil, or anywhere the monsoon is a design case. Flat ground passes every slope test by definition, so on a site whose problem is drainage rather than gradient this is the only test on the card that will exclude anything at all.
What you see after a run
Generate the layout as usual. The terrain result is a layer of the plot, off until you ask for it.
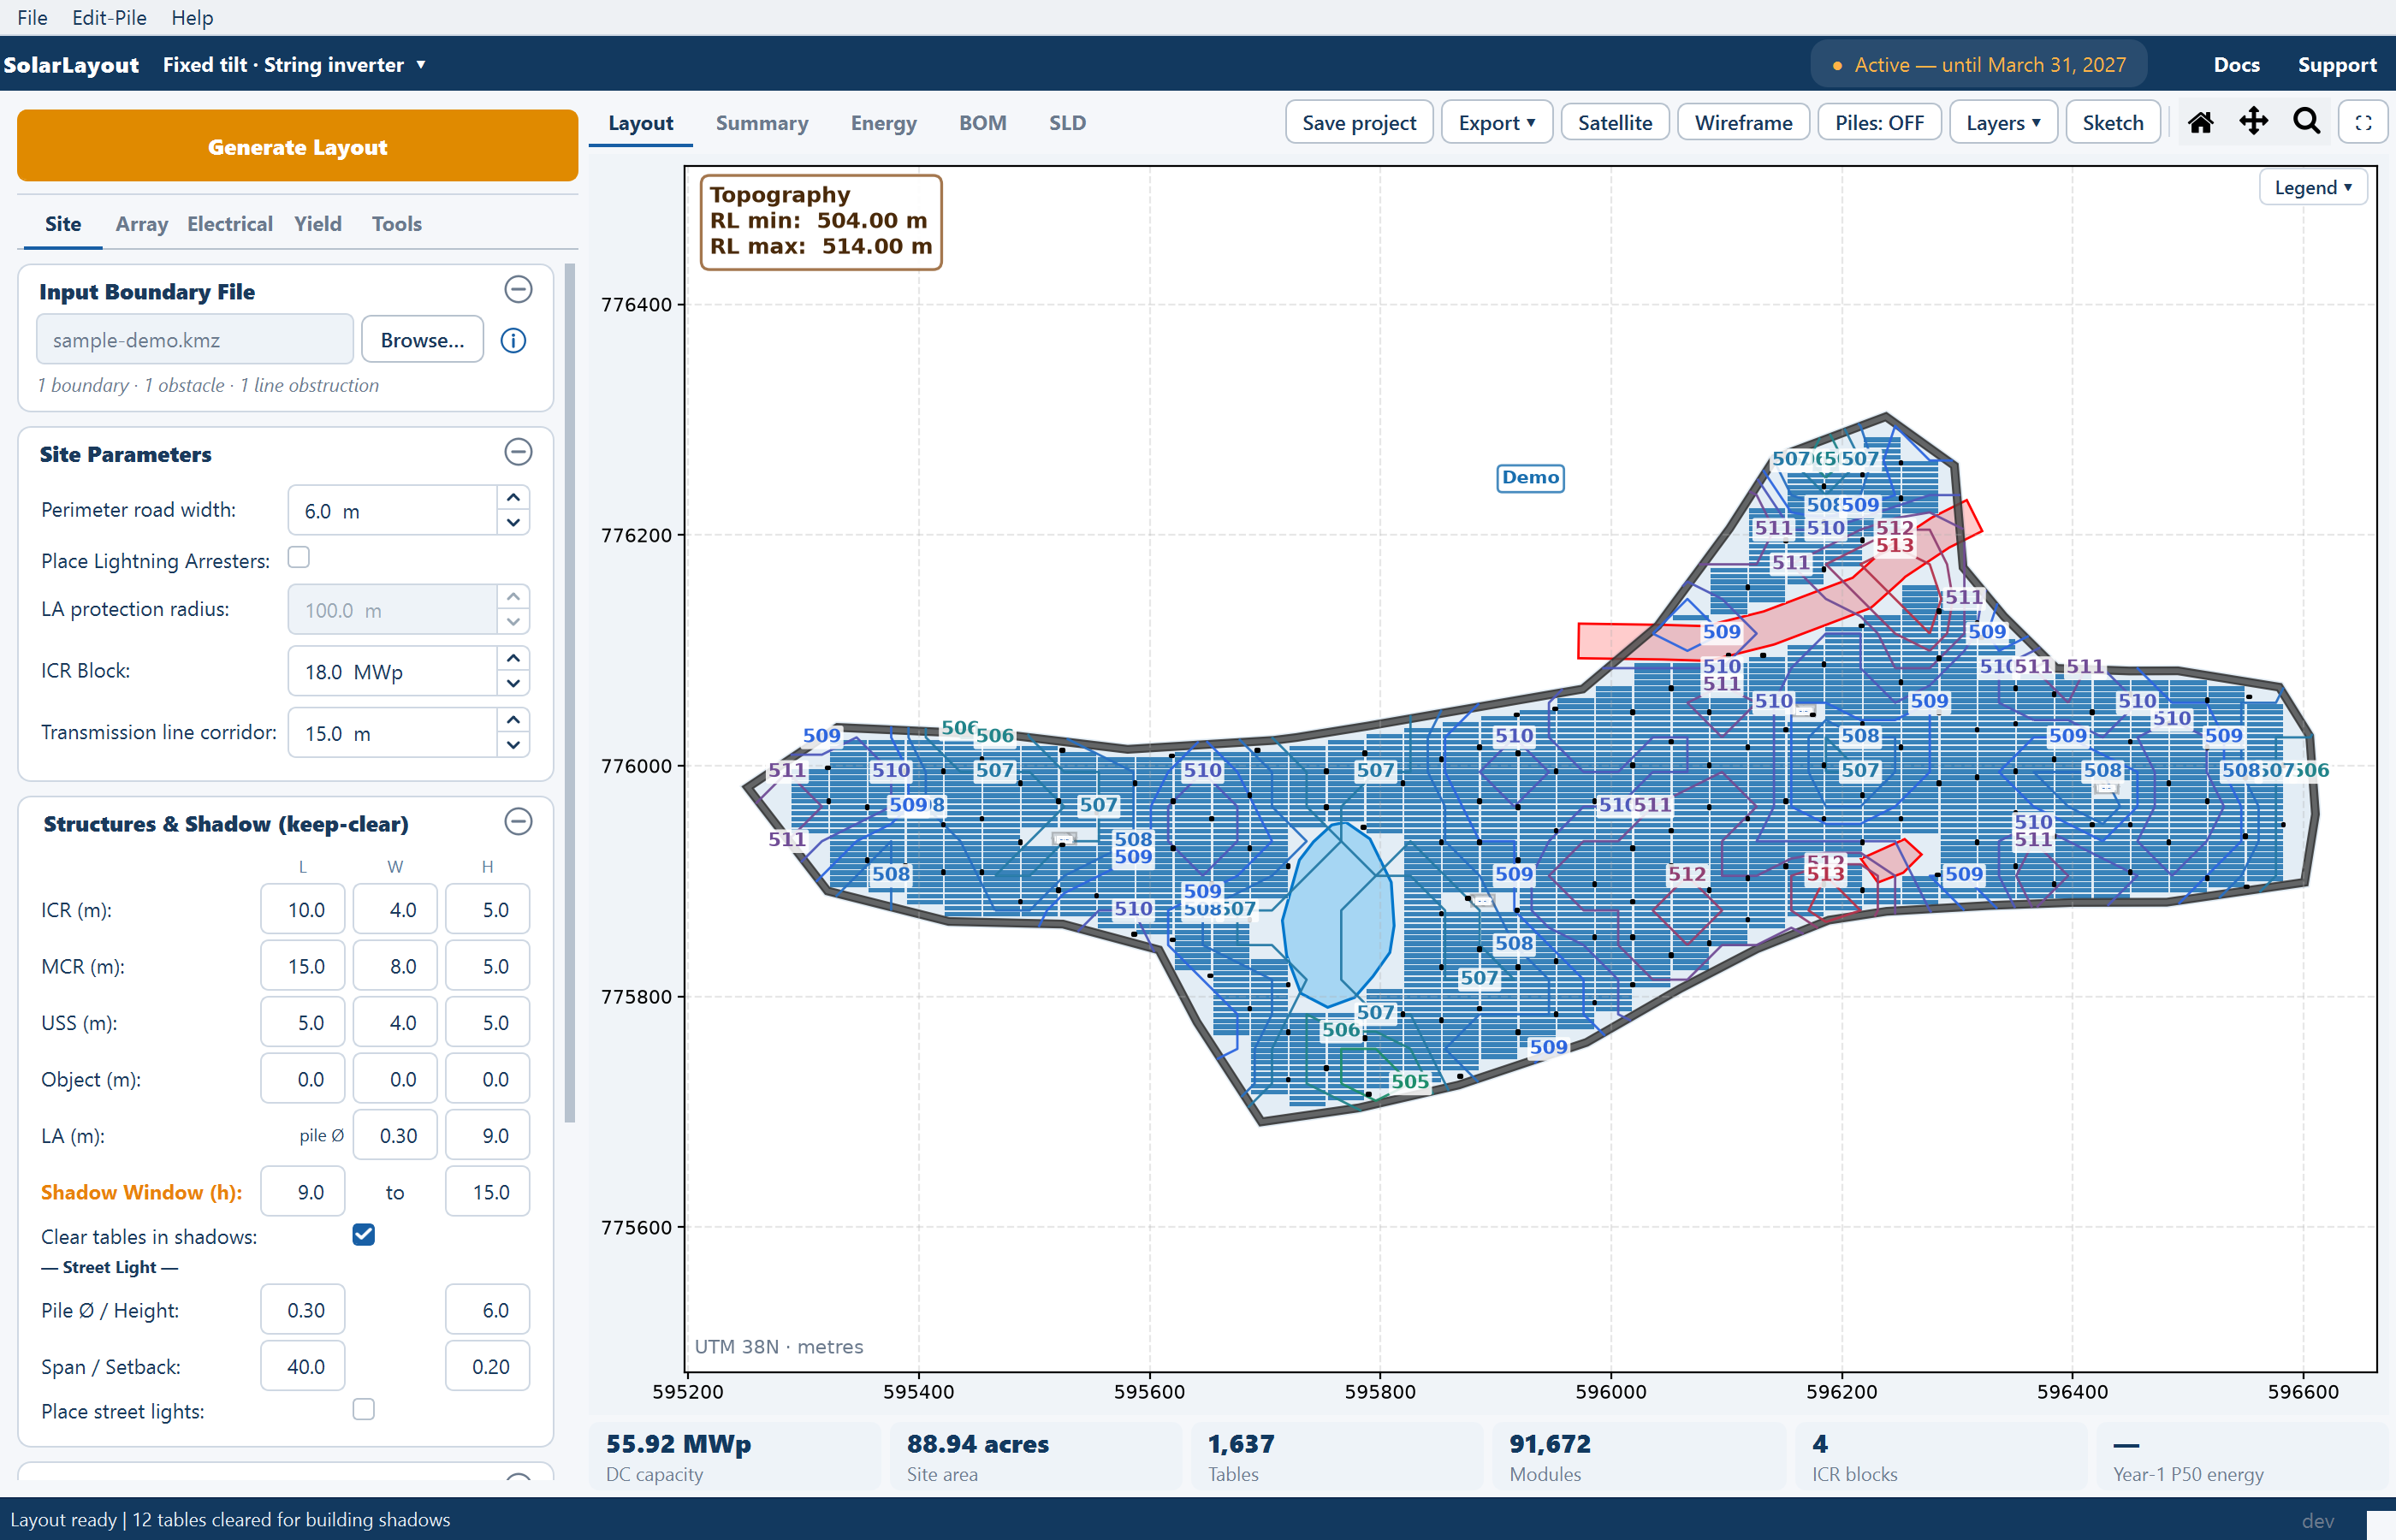
- Coloured contour lines over the plot, running green at the low elevations through blue to red at the high ones — so the ramp reads as a height scale without a legend.
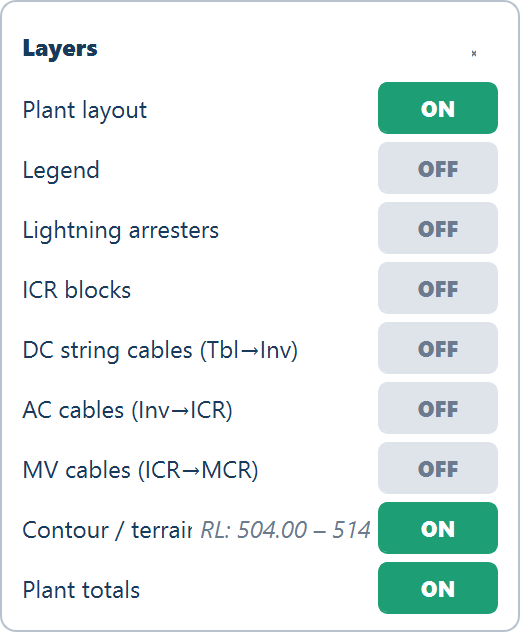
- The Contour / terrain row of the Layers ▾ popover shows and hides those contours. Leave them off while you read the array, and on while you are arguing about the exclusions.
- The row's readout — RL: min – max m · Excluded: x ac / v m³ — gives the range of reduced levels (RL) the model found across the site and the excluded area in acres. The excluded area is the number to check.
The contour lines are carried into the CAD drawing on their own layer, so the ground model the exclusions came from travels with the layout. See CAD drawing export.
What this does and does not do
Any terrain failure is not fatal. If there is no network connection, or the file cannot be read, the layout proceeds without terrain exclusion — you get a complete layout that silently ignored the ground. Always check that the Contour / terrain readout reports an excluded area before assuming the limits were applied.
Being clear about the boundaries of this feature:
- It excludes unbuildable ground. That is the whole of its job — it decides where a table may stand.
- It does not model terrain shading. A ridge to the east or a hill to the south-west will shade the array in the real world, and none of that appears here or in the energy estimate. The only shading modelled is row-to-row shading between the tables and the year-round shadow of the structures you place. See Shading losses.
- It does not model a distant horizon. No horizon profile is read or applied.
- It does not produce a grading design. There is no balance of cut against fill and no levelling plan. Ground is either within your limits or excluded.
- It is not a substitute for a geotechnical investigation. The relief limit is a geometric test on an elevation model. It says nothing about what the soil under a pile will hold.
Used the way it is meant to be used, it answers one question well: given these limits, how much of this site can actually carry a plant? Everything downstream — capacity, yield, quantities — then reflects the answer rather than assuming flat ground.
Where to go next
Site parameters
Perimeter road, arrester coverage and the control room block size
Obstructions and exclusions
Water bodies, corridors and areas you rule out by hand
How placement works
The order the usable area is built up and the tables are placed
Views and layers
The Layers popover the terrain row lives in
Structures and shadow
Footprints and heights for the control rooms, unit substations, objects, arresters and street lights on the Site tab — and the shadow they clear tables out of.
Inverter settings
How many strings feed one inverter or string monitoring box, what a manufacturer inverter file changes, and where the AC figures land in the Summary view.