Views, layers and tools
The five views of the plant, the tools beside the view tabs, the Layers popover, the plant chips, and the Summary and Energy views.
The right side of the main window shows one plant five ways. The Layout view is the drawing; Summary is the per-plant figures as a sheet; Energy is the yield result; BOM is the bill of materials; SLD is the single-line diagram. They are tabs across the top of the right side, and each takes the whole area under the header.

Switch with a click or with Ctrl+1 to Ctrl+5 in tab order. The Energy tab reads "Energy •" when a result landed while another view was up.
The tools row
The tools sit to the right of the tabs and change with the view.
| Tool | View | What it does |
|---|---|---|
| Save project | every view | Writes the session to a project file — Saving and reopening projects |
| Export ▾ | every view | The export menu: the Google Earth file, the CAD drawings, the cable schedule, the Word report and the plot as an image — The project report |
| Satellite | Layout, SLD | An aerial photograph behind the layout, aligned to the site's position. Needs an internet connection; disabled until a layout exists |
| Wireframe | Layout, SLD | Draws tables or tracker units as outlines only |
| Piles: OFF / Piles: ON | Layout, SLD | The pile overlay. The first use opens the pile editor; disabled until a layout exists — Piles |
| Layers ▾ | Layout, SLD | The popover of drawing layers, below |
| Sketch | Layout, SLD | Switches Sketch Mode on — Sketch Mode. Leaving the Layout view switches it off again |
| Home, Pan, Zoom | Layout, SLD | The three navigation tools. Home fits the whole plant |
| ⛶ | Layout, SLD | Opens the plot in the Expanded View window, below |
| Copy | Summary, Energy | Puts the sheet on the clipboard as tab-separated text |
| Open in window | Summary, Energy | Opens the sheet in its own window, which follows the layout |
Zooming and the persistent view
The mouse wheel zooms at the cursor in every view but SLD. Whatever framing you set stays through redraws — a regenerate, a toggle, a moved control room — until you click Home, generate onto a new boundary file, or load a different one. There are no back and forward arrows; the wheel and Home are the way about.
When the window is narrow
Every tool stays reachable at every width. When Satellite, Wireframe and Piles no longer fit beside the tabs, they move to the top of the Layers popover as ON/OFF rows — Satellite image, Wireframe tables, Piles — and the button reads Layers ▾ +3.

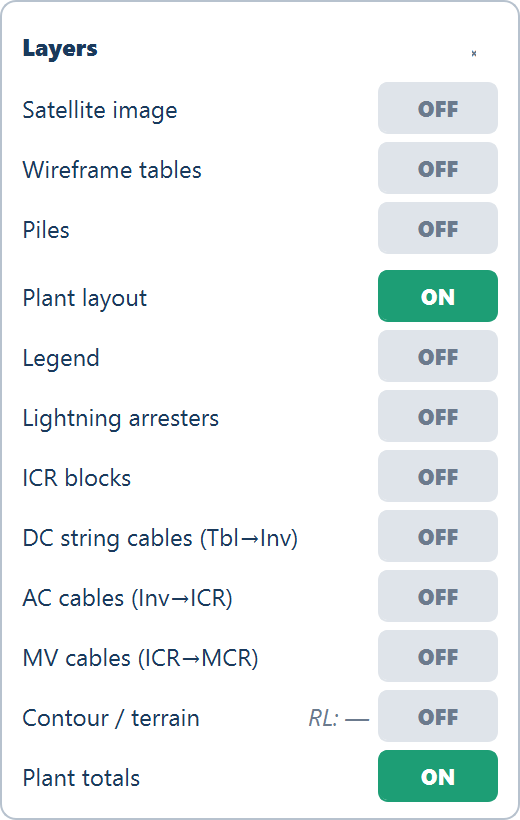
The Expanded View window
⛶ opens SolarLayout — Expanded View: the plot alone in a large, resizable window with a full toolbar and a ⟵ Return to Main Window button. While it is open the main window's plot area reads "Plot is open in the Expanded View window. Close that window to return the plot here."
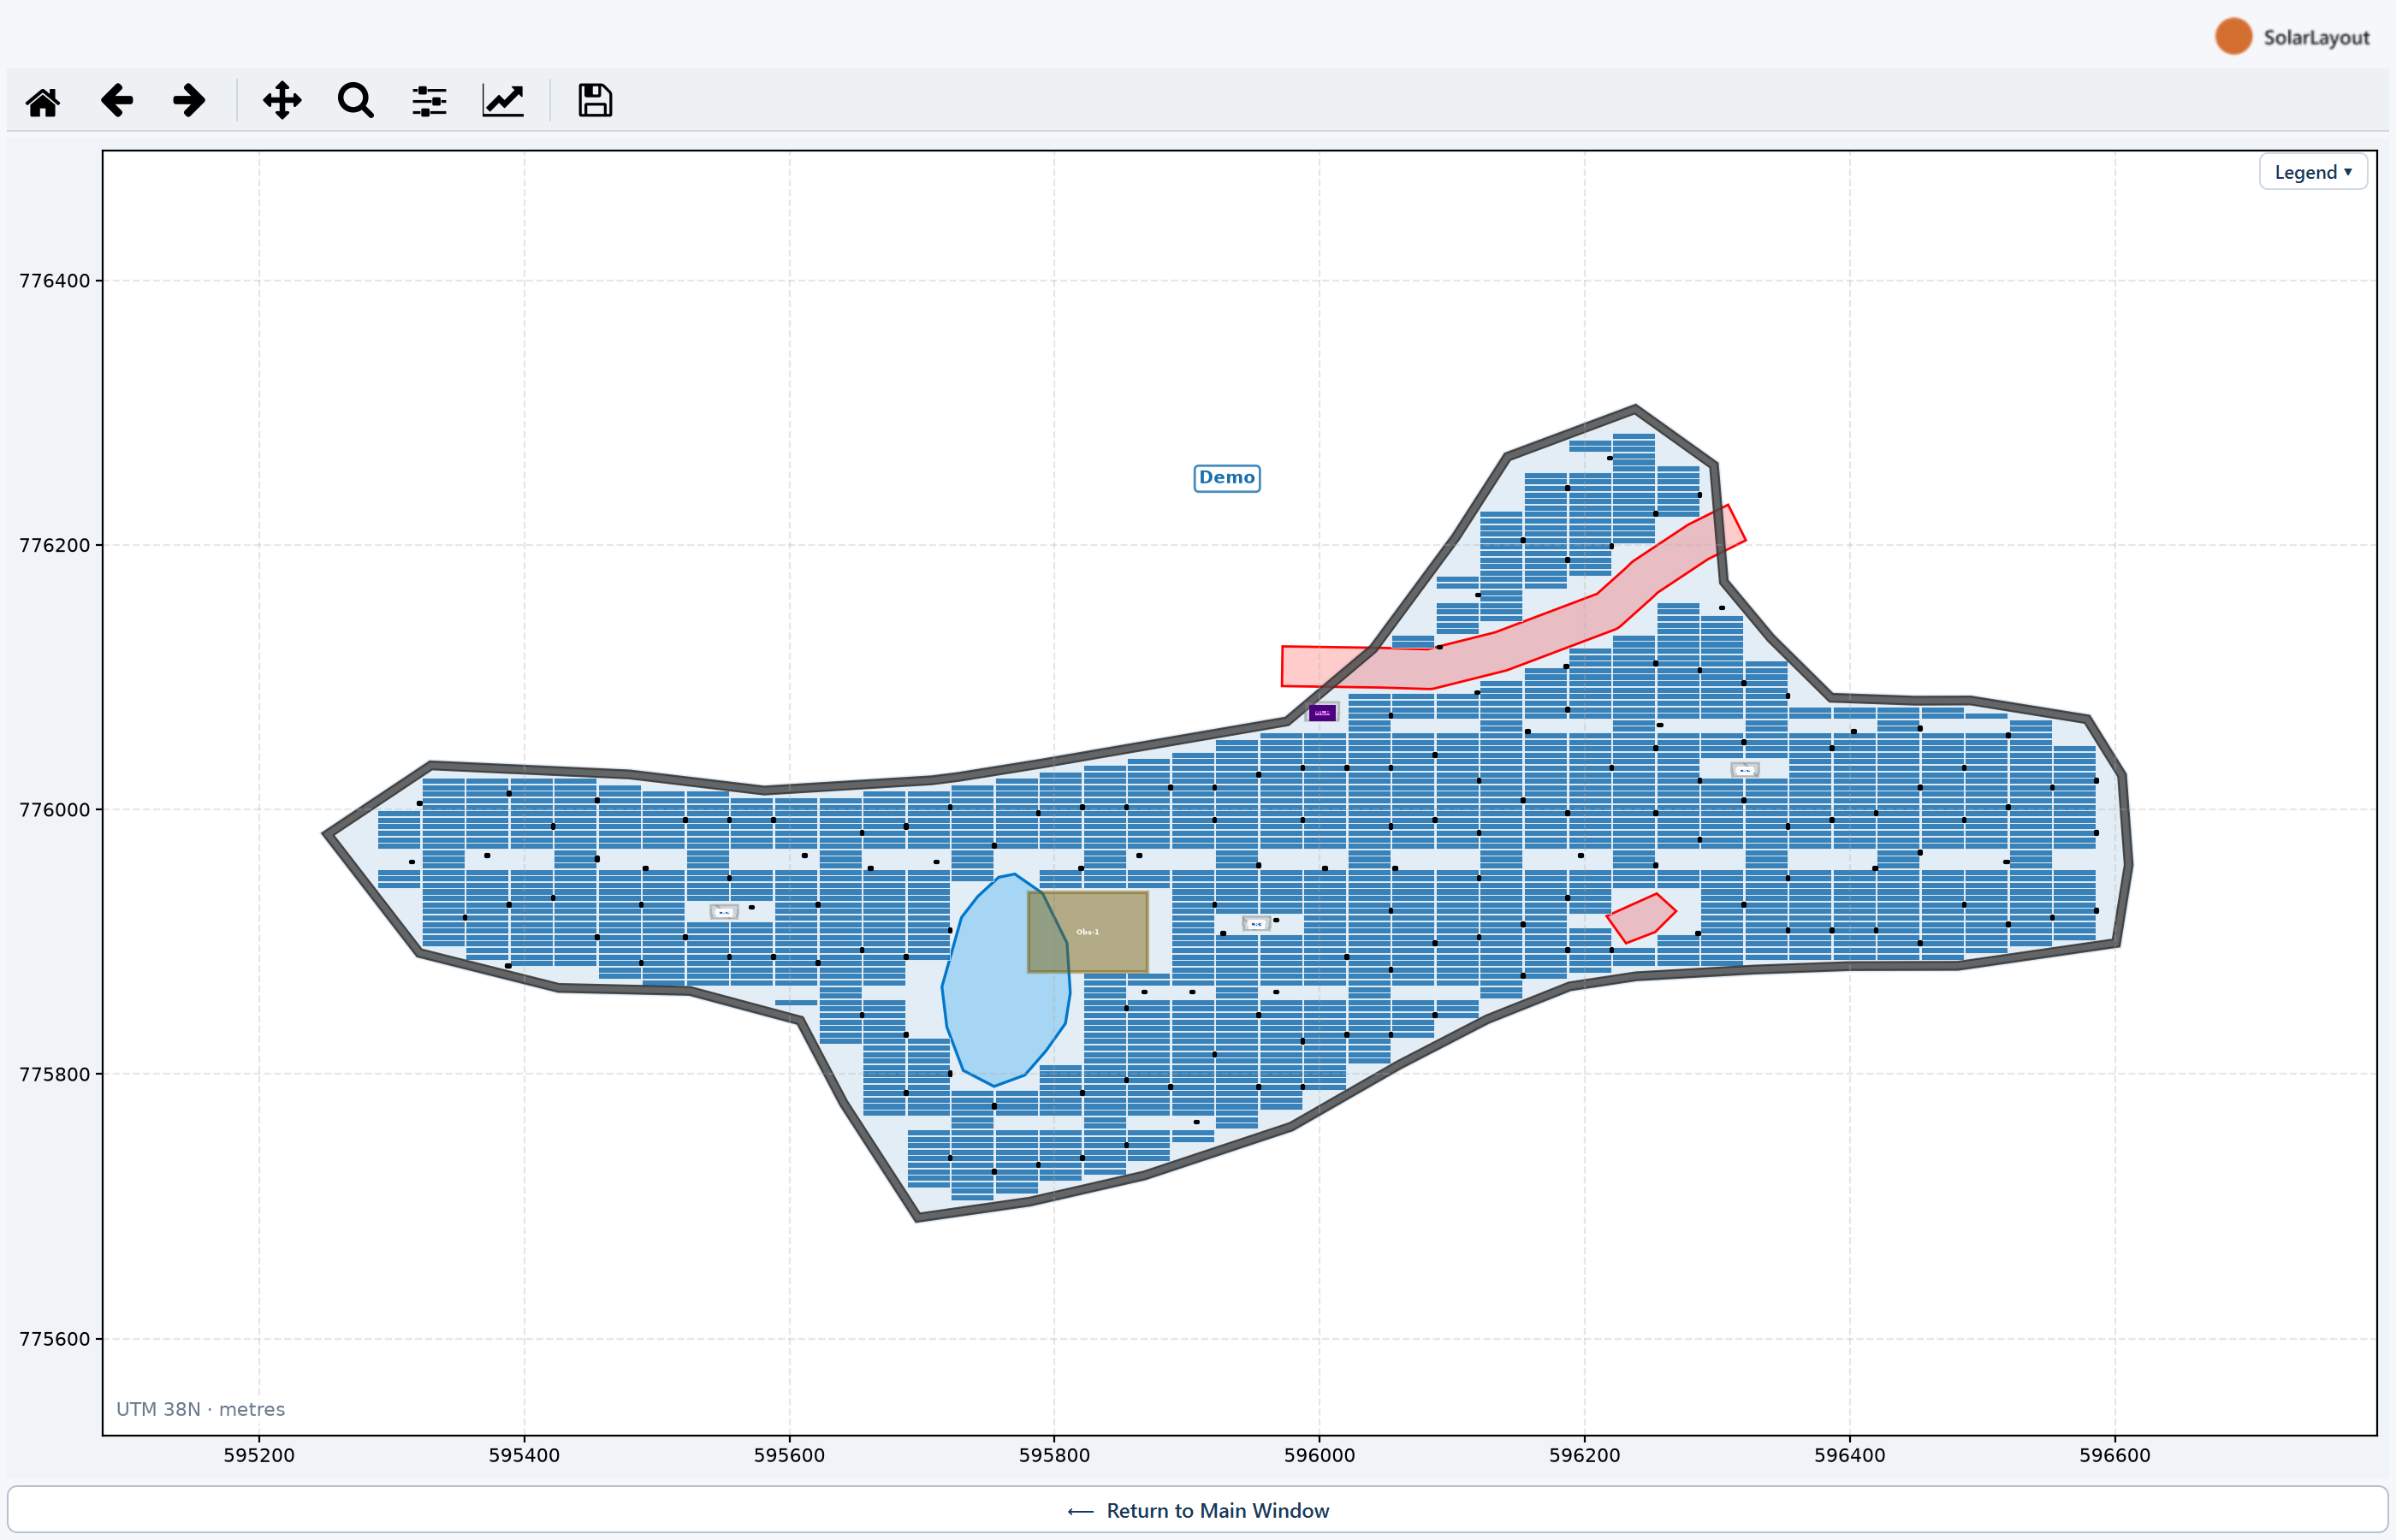
The Layers popover
Layers ▾ opens a small popover of ON/OFF pills. Rows in order, with the state each starts in after a layout:
| Row | Default | What it shows |
|---|---|---|
| Plant layout | ON | The placed tables and equipment. OFF leaves only the boundary and obstacles |
| Legend | OFF | The legend — the same switch as the Legend ▾ chip on the plot |
| Lightning arresters | OFF | The arrester rectangles, their labels and their protection circles |
| ICR blocks | OFF | Each control room's block filled in its own colour and outlined |
| DC string cables (Tbl→Inv) | OFF | Enabled only when cables were calculated |
| AC cables (Inv→ICR) — reads DC cables (SMB→CI) on a central-inverter design | OFF | Enabled only when cables were calculated |
| MV cables (ICR→MCR) | OFF | Needs a main control room placed and cables calculated |
| Contour / terrain | OFF | The elevation contours, with an RL: readout of the range and the excluded ground |
| Plant totals | ON | The plant chip row under the view; OFF hides it |
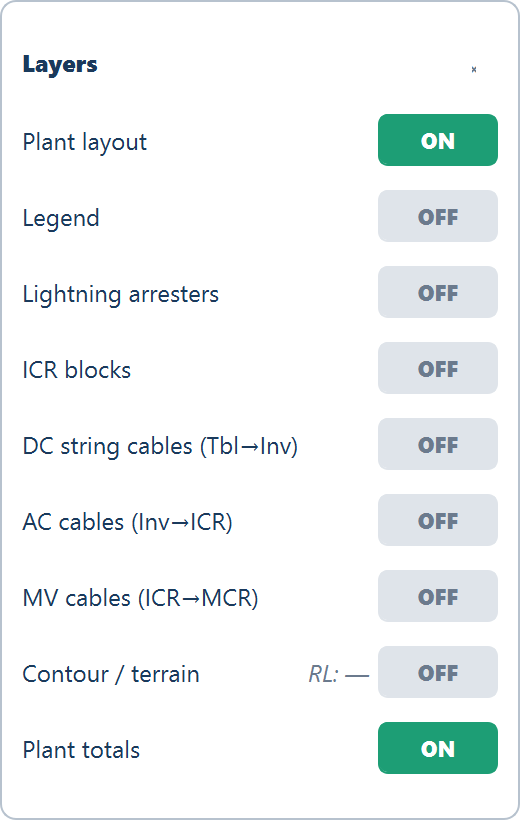
A first layout is therefore drawn as the placement alone: cables, arresters and contours have been computed where you asked for them, but stay off until you switch them on. The plot carries a units note in its bottom-left corner, for example "UTM 38N · metres".
The Legend chip
The legend is folded away by default so it never sits on the drawing. A small Legend ▾ chip in the plot's top-right corner (Layout view only) unfolds it; the chip then reads Legend ▴, and the open legend can be dragged.
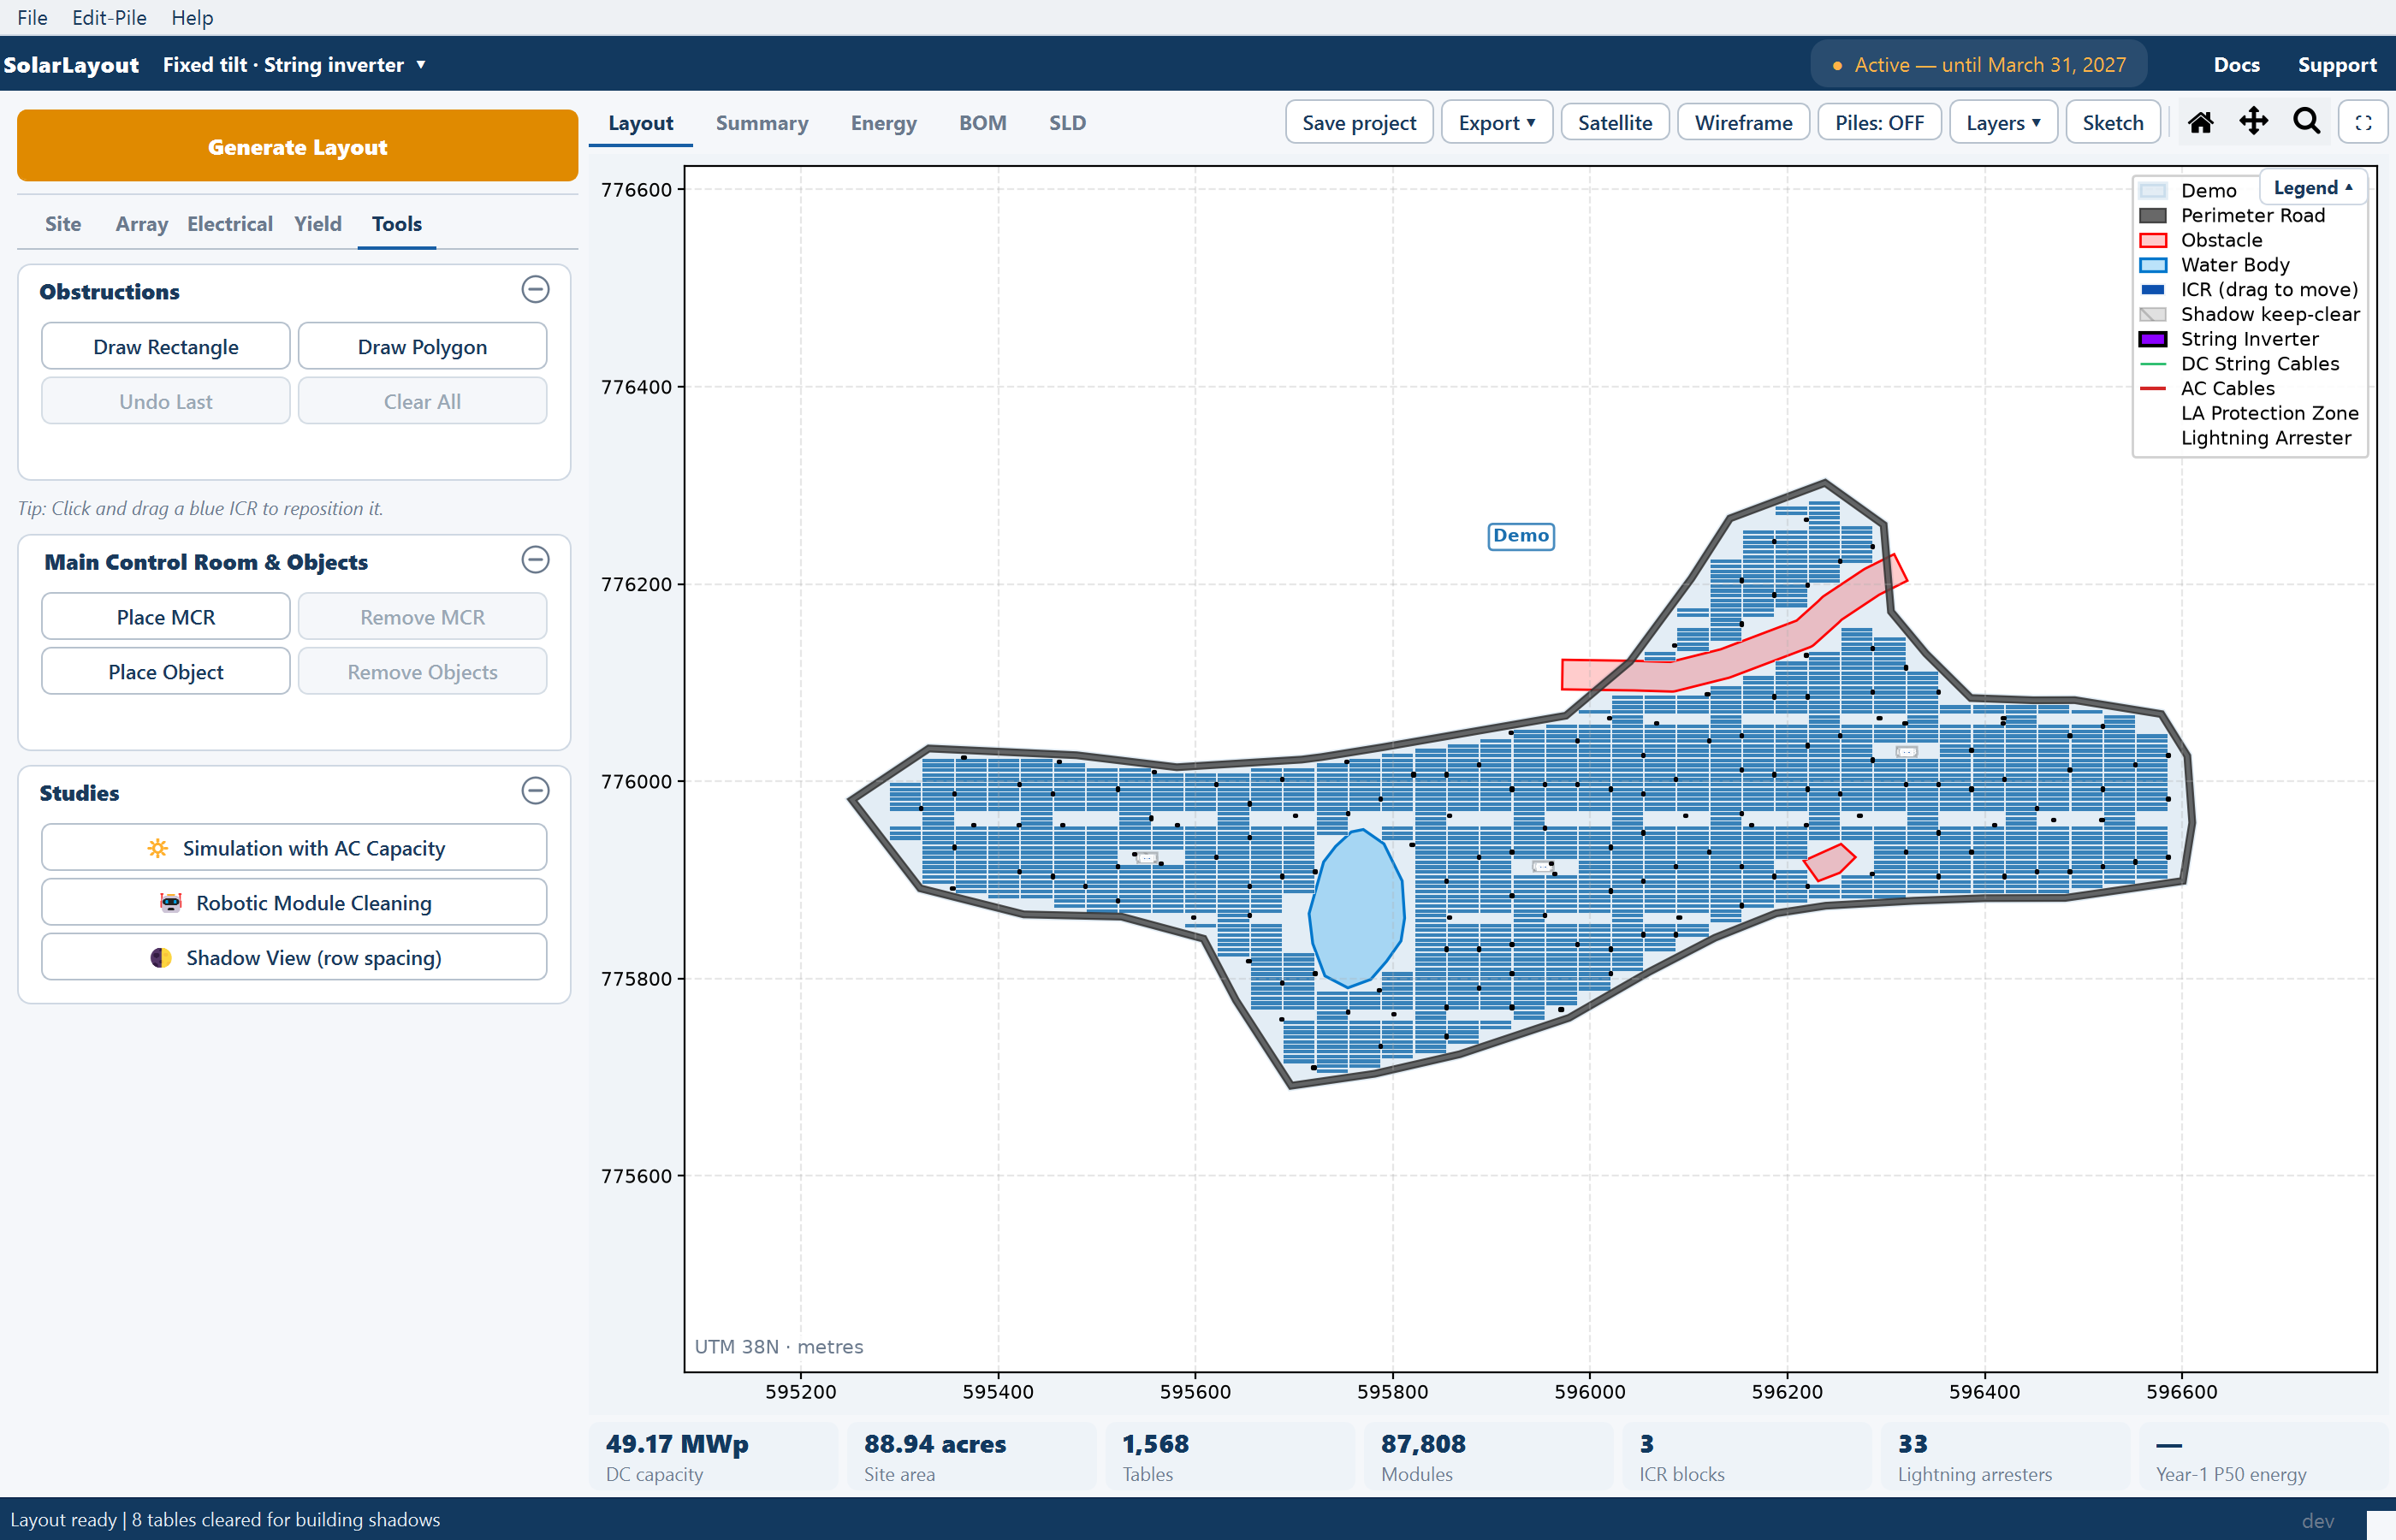
The plant chips
One row of chips runs under every view and never wraps. It is the only place the plant totals are shown — the status bar does not carry them.

| Chip | Value |
|---|---|
| DC capacity | Installed DC, in MWp |
| Site area | The gross boundary area, in acres |
| Plants | The number of plots — shown only for a multi-plot file |
| Tables or Trackers | Units placed |
| Modules | Modules across the plant |
| ICR blocks | Inverter control rooms placed |
| Lightning arresters | Shown only once some are placed |
| Year-1 P50 energy | Year-one generation in MWh, or — before an energy run |
Clicking any chip opens the Summary view; the energy chip opens the Energy view. When the row is too narrow the lowest-priority chips hide first — Lightning arresters, Plants, ICR blocks, Site area, Tables, Modules — and DC capacity and energy go last. Water-body results are left out of the totals.

The Summary view
The Summary view is the per-plant figures as a sheet turned on its side: a Metric column, one column per plant, and a Total column when there are two or more plants. A plant's column header reads "<plant> ›", and clicking it shows that plant on the Layout view.
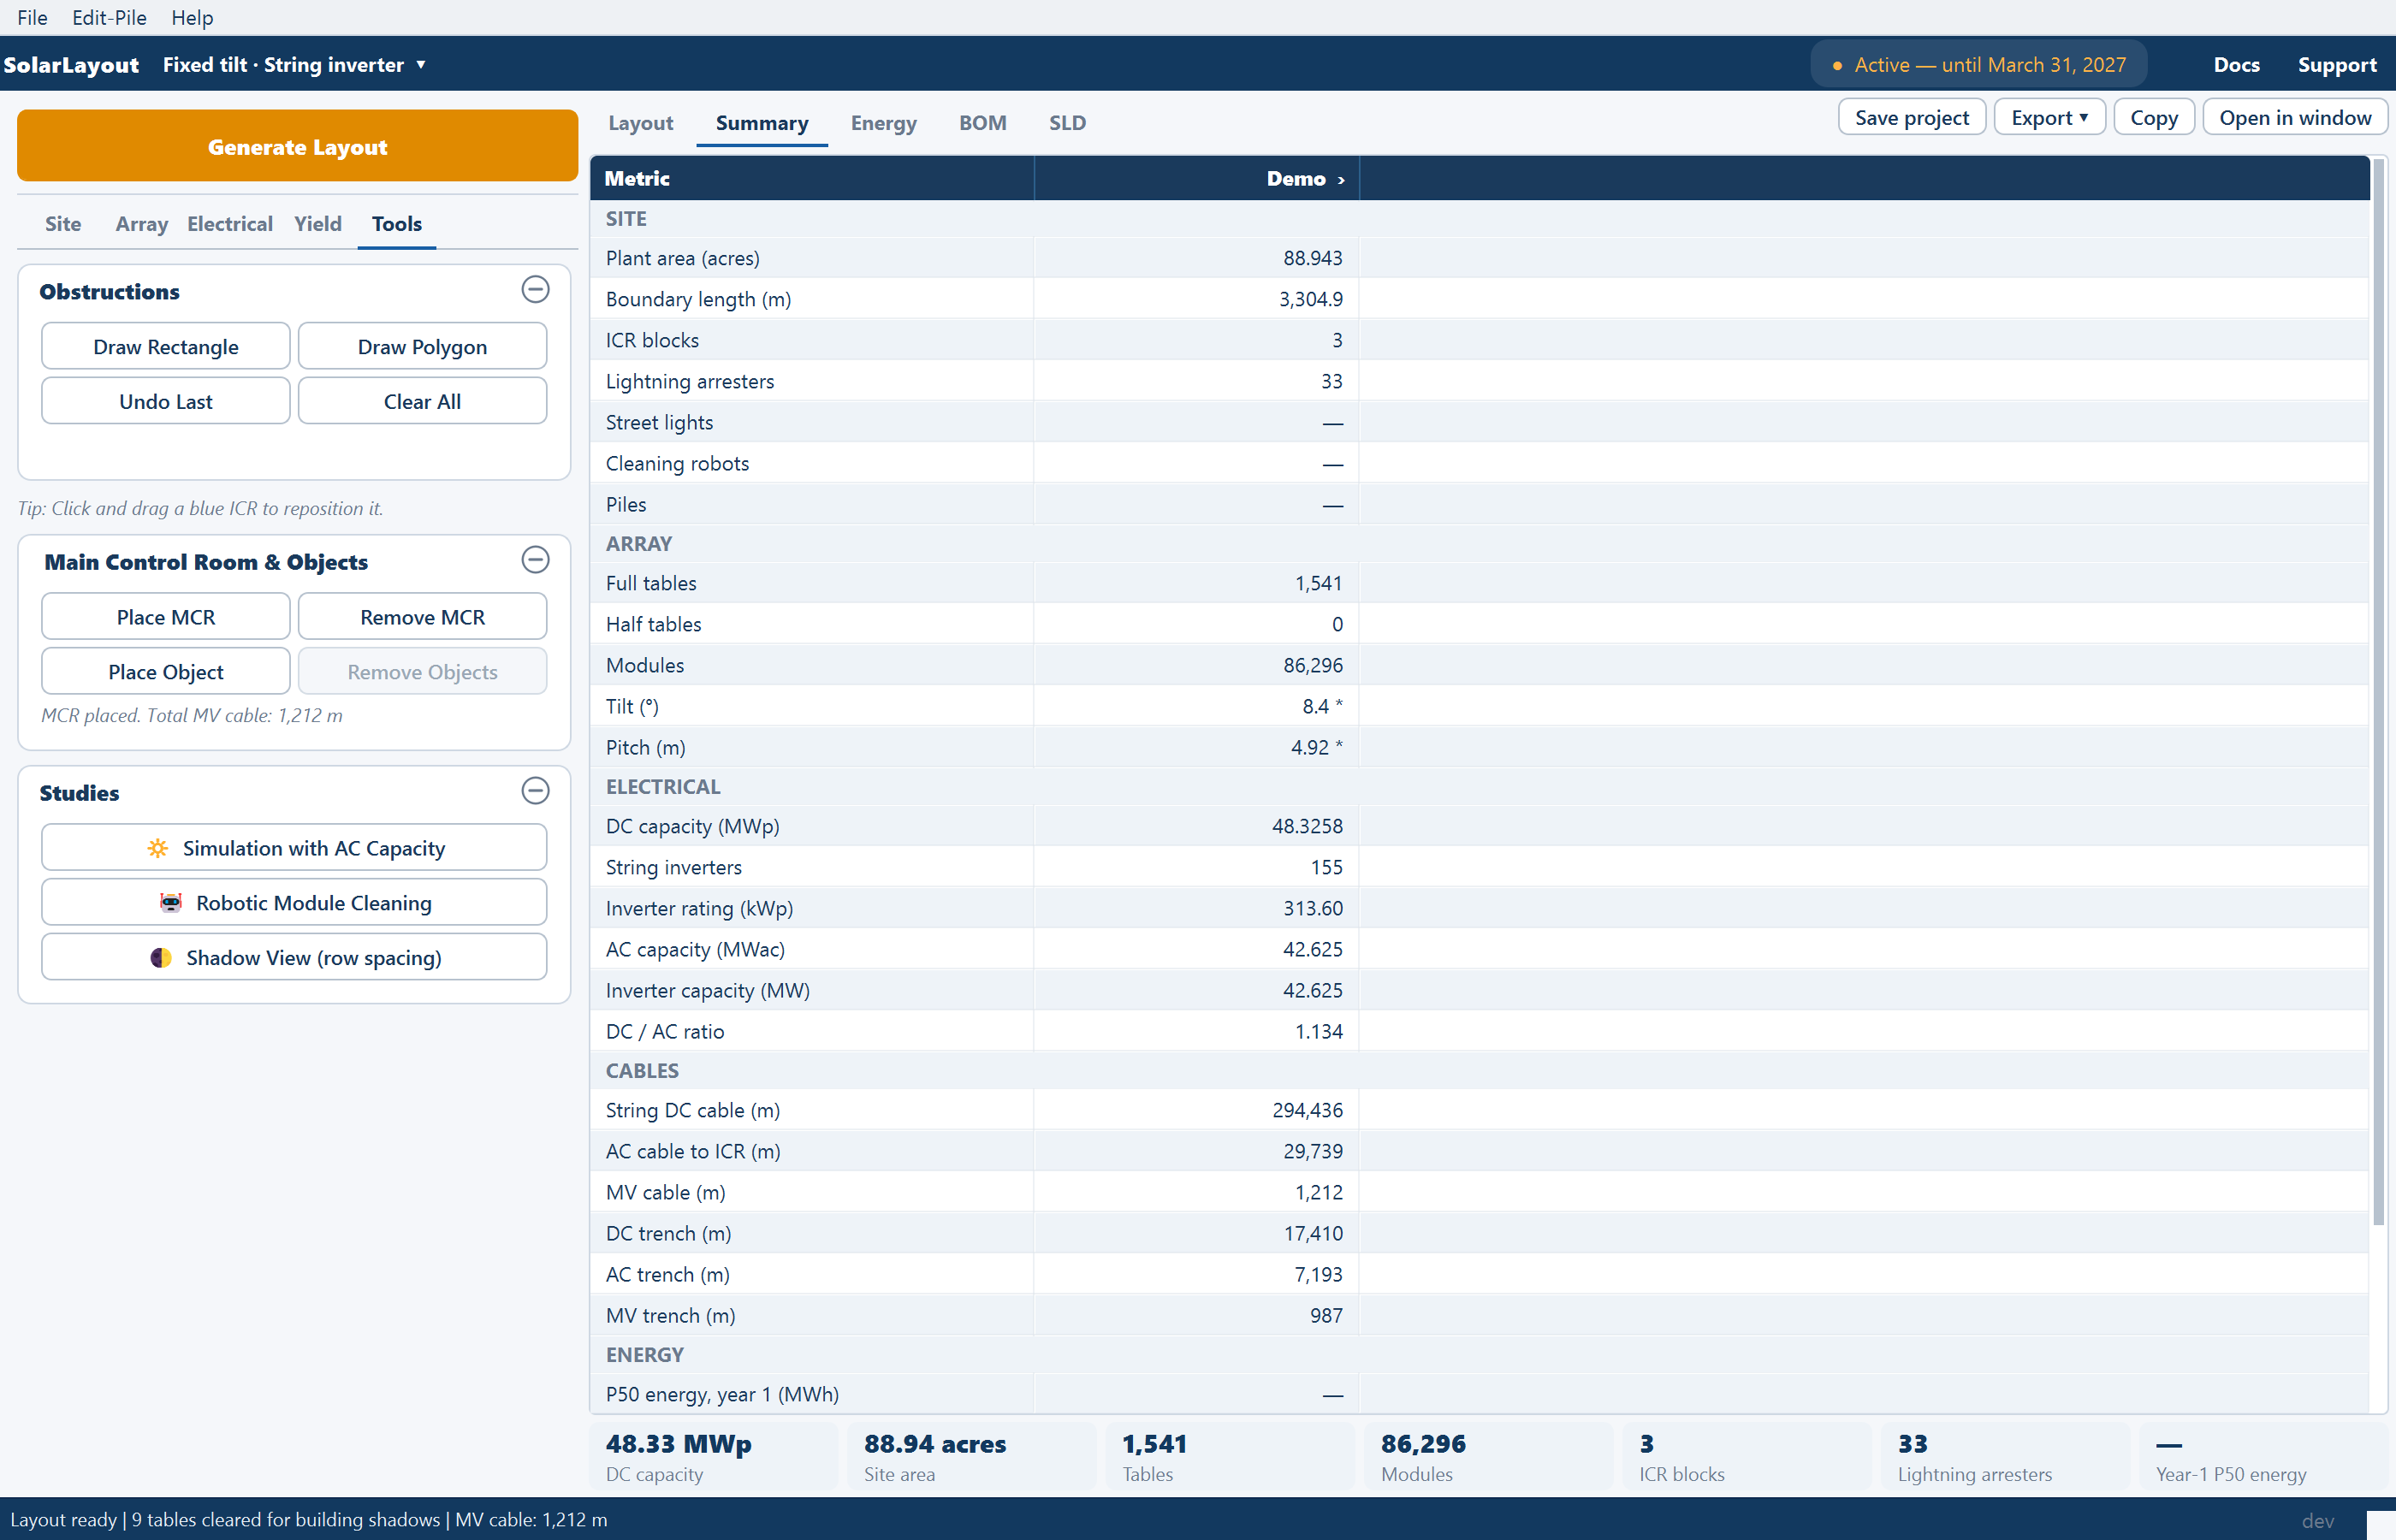
The rows are grouped:
| Group | What it holds |
|---|---|
| SITE | Plant area, boundary length, ICR blocks, lightning arresters, street lights, cleaning robots, piles |
| ARRAY | Full and half tables (or trackers), modules, tilt (or max tracking angle), pitch |
| ELECTRICAL | DC capacity, inverters or monitoring boxes and their ratings, AC capacity, inverter capacity, the DC / AC ratio |
| CABLES | The string DC, AC or DC-trunk, and MV conductor lengths, and the three trench lengths |
| ENERGY | Year-one energy at each of your three exceedance probabilities, CUF, and the lifetime total |
A trailing * on tilt or pitch means the value was auto-calculated (fixed tilt
only). A — means not computed — the cable rows before cables are calculated,
the energy rows before a run. Before any layout the view reads "Generate a
layout to see the per-plant summary here."
Copy puts the whole sheet on the clipboard as tab-separated text, ready for a spreadsheet or a document. Open in window opens SolarLayout — Summary, a separate window with a Summary tab and a Monthly energy (Year 1) tab — the second enabled once energy exists — that follows the layout as you work. Every row is defined in Summary rows.
The Energy view
Before a run the view reads No energy result yet, explains what the run will use, and offers a gold Calculate energy button — the same action as Calculate Energy on the Yield tab. After a run it shows four tiles — Year-1 energy, Specific yield, Performance ratio, CUF — the monthly table to IEC 61724-1, an irradiation and performance-ratio chart, and the monthly energy bars. See How yield is calculated.
The BOM and SLD views
BOM shows the editable bill of materials on the right and hands the left column to the BOM TOOLS panel under a green banner; SLD shows the drawing sheet and hands the column to SLD TOOLS under a blue banner. Each banner carries the Exit button that gives the column back. See Bill of materials and Single-line diagram.
Where to go next
The main window
The ribbon, the pinned Generate Layout button, the five stage tabs of inputs on the left, the views on the right, and the status bar.
Which boundary file to use
The three kinds of boundary file the application accepts, what each one carries, and how the Input Boundary File card on the Site tab reads them.