Summary view
Every row of the Summary view — how the per-plant sheet is laid out, what each row reports, which rows rename with the design, and when a row reads — or 0.
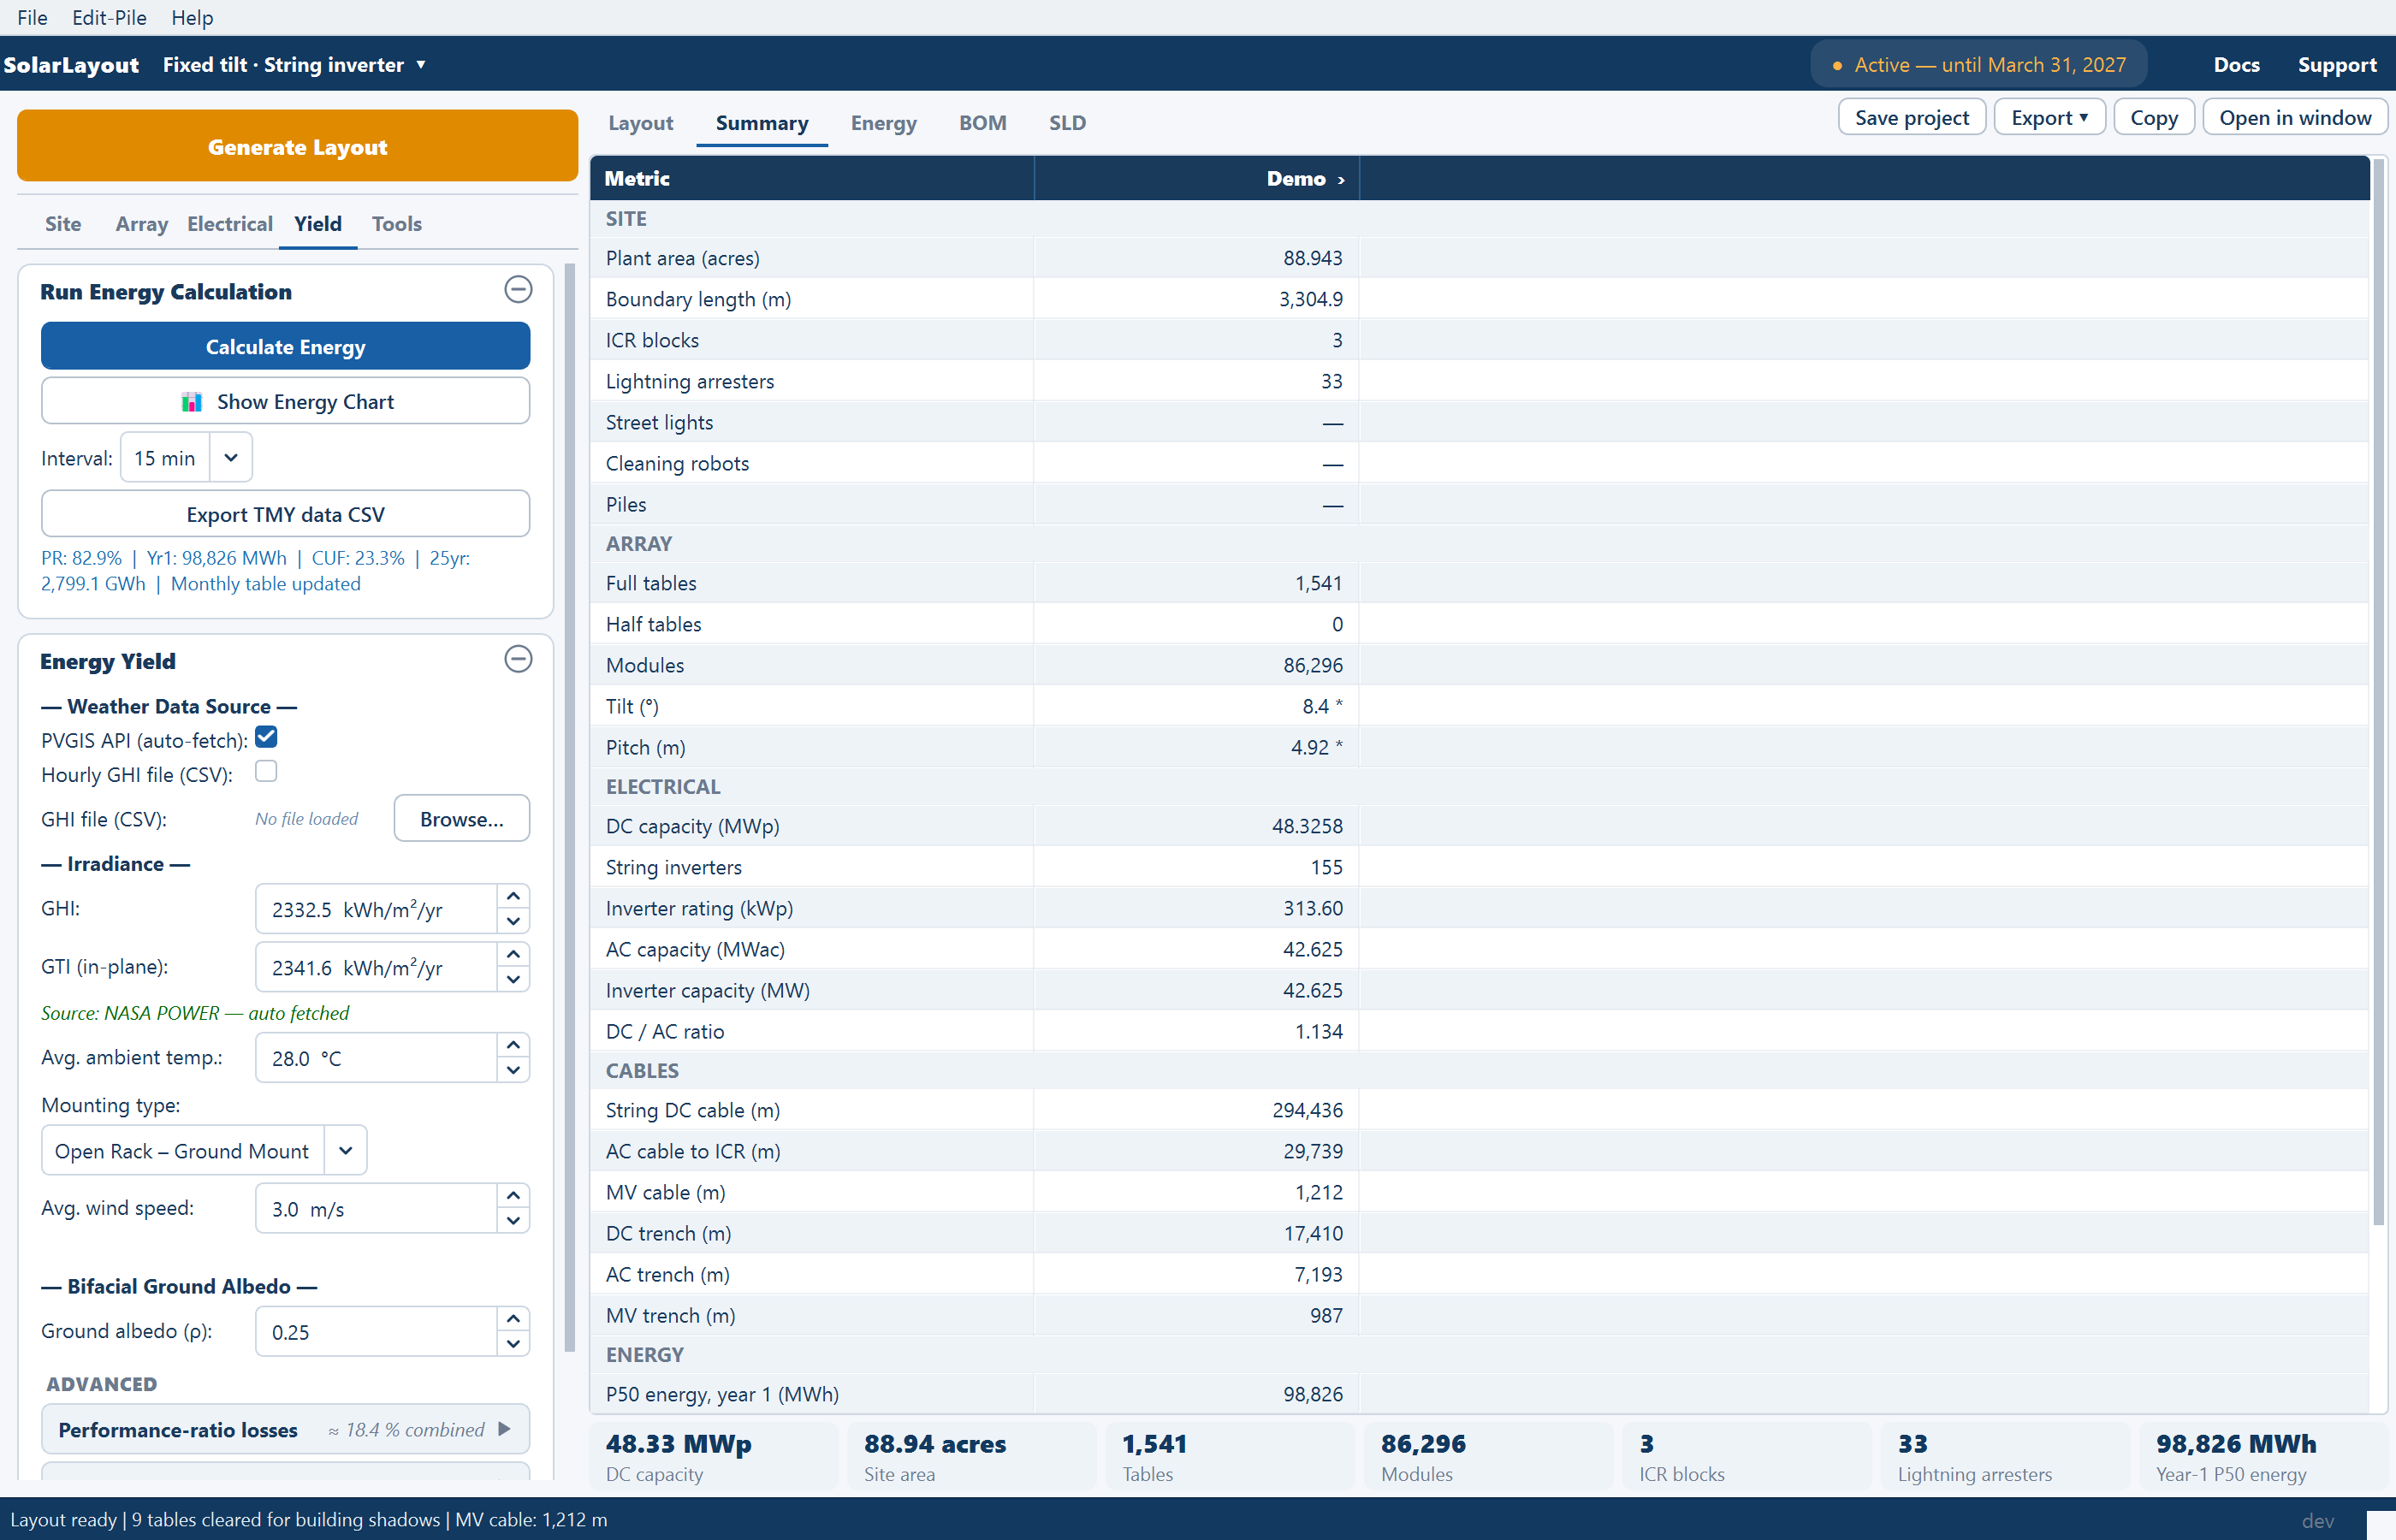
The Summary view is the per-plant sheet turned on its side: a Metric column on the left, one column per plant — one per plant boundary in your file — and a Total column when there are two or more plants. The rows are grouped under SITE · ARRAY · ELECTRICAL · CABLES · ENERGY. It is the second of the five view tabs across the top of the right side (Ctrl+2), and before a layout exists it reads "Generate a layout to see the per-plant summary here." See Views.
How the view is laid out
- Plant column headers carry the plant's name followed by ›. Clicking one shows that plant on the Layout view.
- Total appears only with two or more plants and sums every plant. See Multi-plot sites.
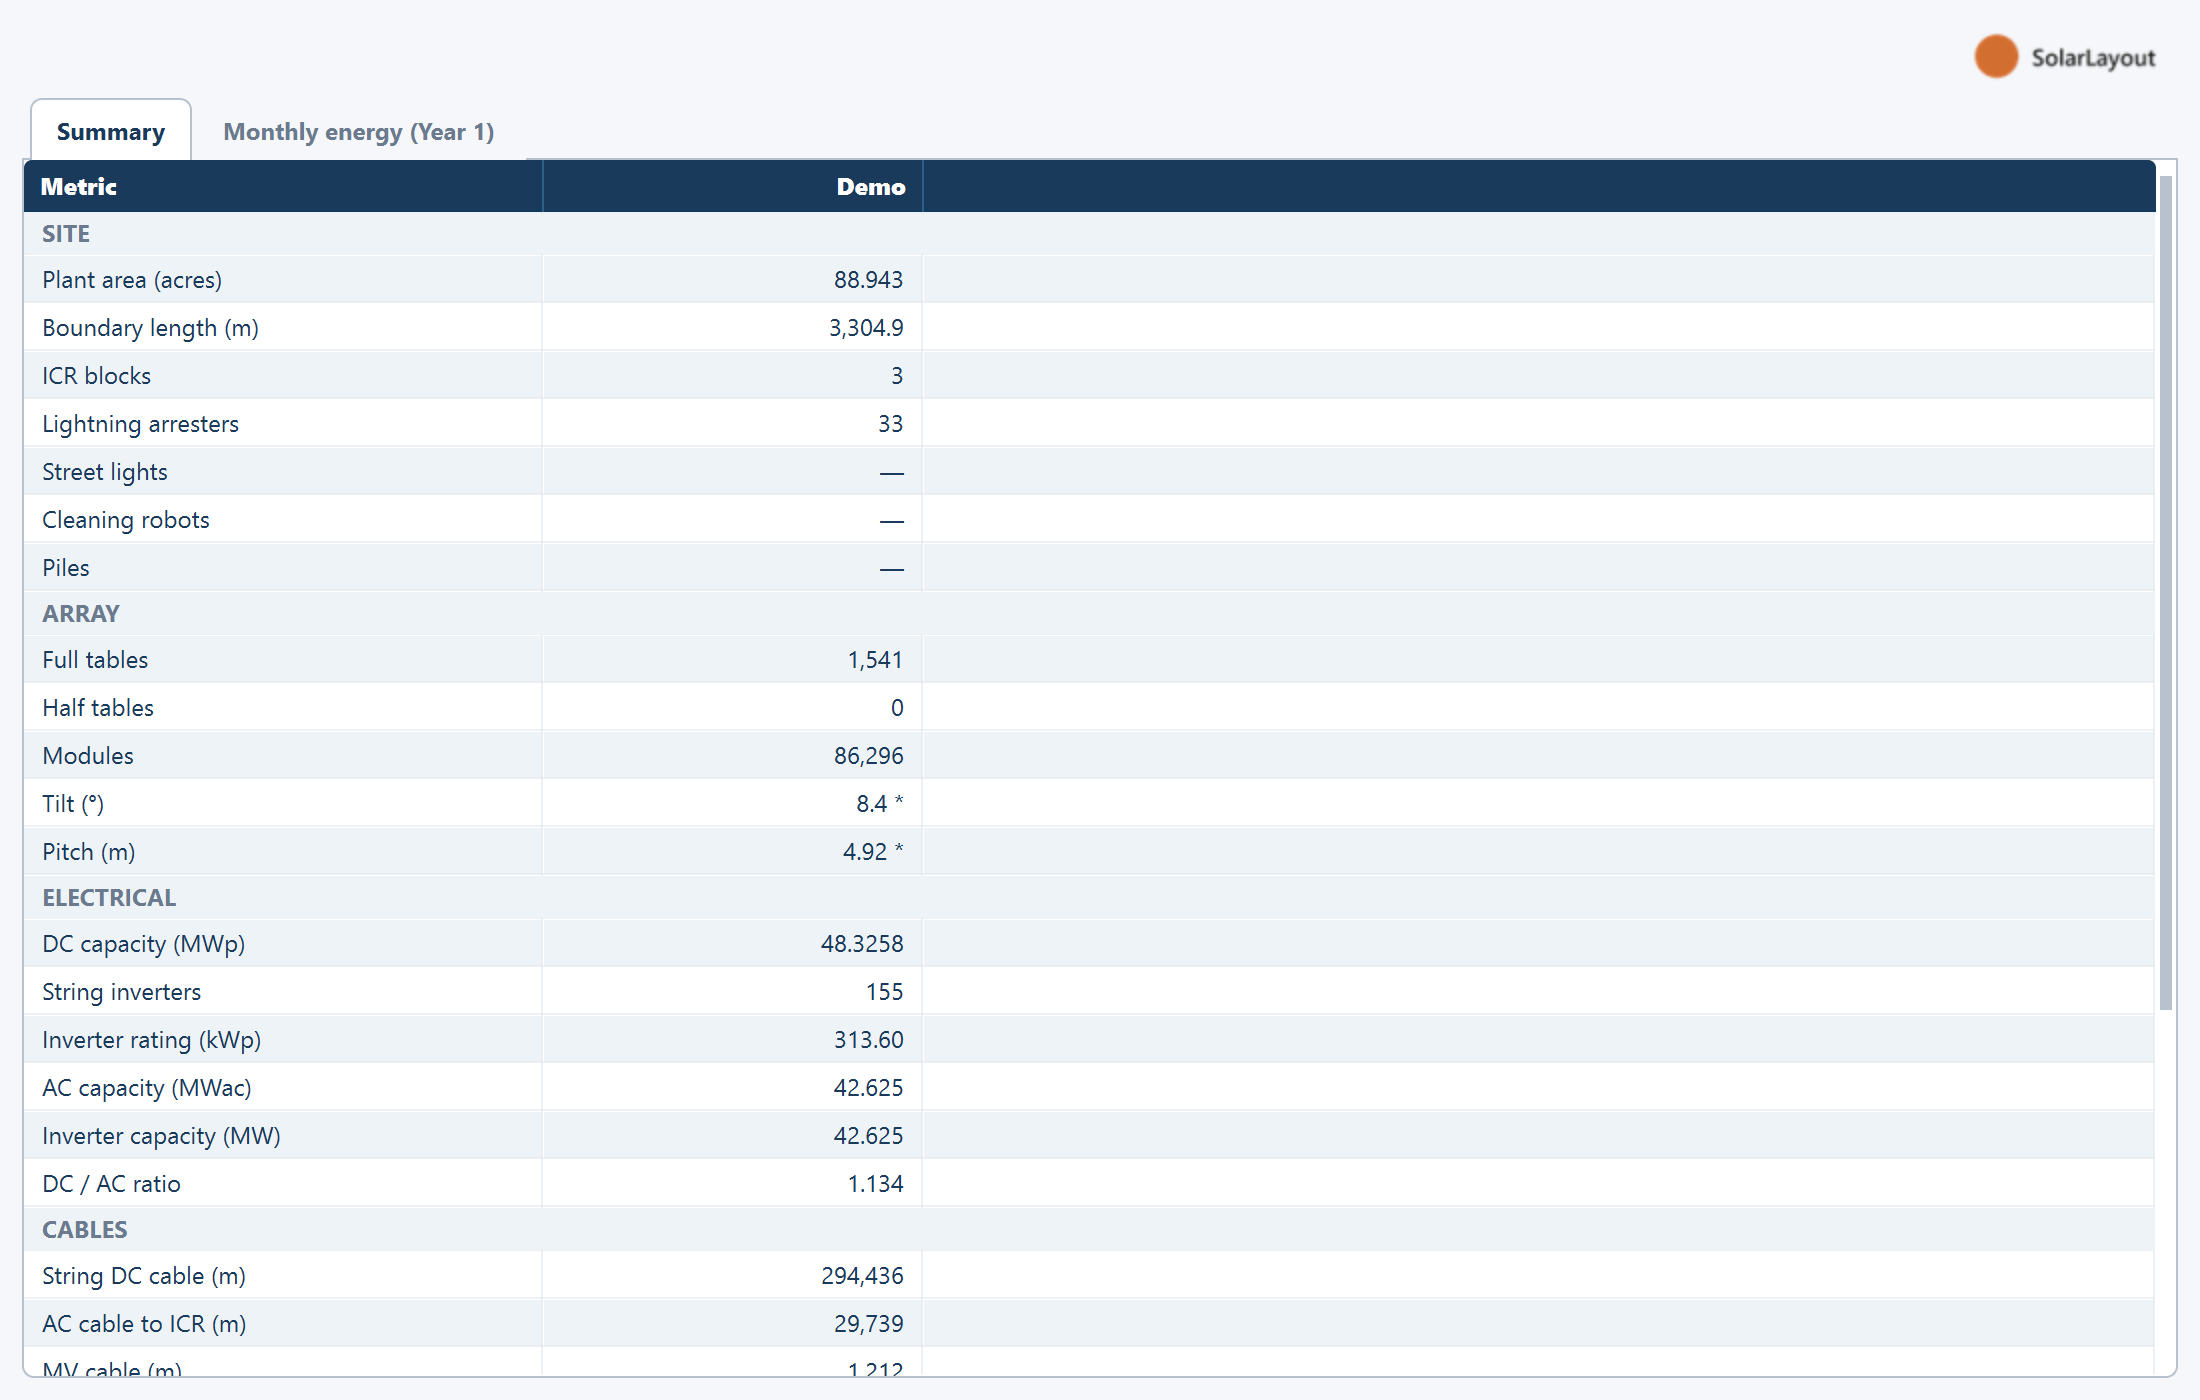
- Two tools sit right of the view tabs. Copy puts the whole sheet on the clipboard as tab-separated text ("Copied. Paste into Excel or a document."). Open in window opens SolarLayout — Summary, a separate window that follows the layout as it changes, with two tabs: Summary and Monthly energy (Year 1), the second enabled once energy exists.
- The Plant totals row of the Layers ▾ popover governs the row of plant chips under every view, not this sheet. Clicking any chip opens the Summary view; the energy chip opens the Energy view.
Reading the sheet
A trailing asterisk means the value was calculated, not entered. Tilt
and Pitch carry a * when the layout derived them from the site latitude
rather than taking an override from you. It appears on fixed tilt only. No
asterisk on those two rows means you supplied the number yourself — the fastest
way to check that an override you ticked took effect. See
Spacing and tilt.
A dash means not computed. A — is not a zero and not an error. The
commonest case is the whole CABLES group when Calculate cables was left off:
the inverter and box counts are still computed, and every cable row reads —.
The ENERGY rows read — until energy has been calculated.
Whole numbers of four or more digits get thousands separators on screen.
SITE
| Row | What it means | Reads — or 0 when |
|---|---|---|
| Plant area (acres) | The plant's gross boundary area, taken before the perimeter road setback | Never — filled by the layout run |
| Boundary length (m) | The perimeter of the plant boundary | Never |
| ICR blocks | Inverter control rooms placed: the plant capacity divided by ICR Block, rounded up, then re-checked after tables under the footprints are cleared | Never |
| Lightning arresters | Arresters placed | 0 unless Place Lightning Arresters was on, or you added arresters in Sketch Mode |
| Street lights | Street light poles placed along the perimeter | 0 unless Place street lights was on |
| Cleaning robots | The fleet the cleaning study sized | Empty until Robotic Module Cleaning has been run |
| Piles | Tables multiplied by the piles in the pattern you defined | Empty until a pile pattern exists |
Plant area is the site's area, not the array's. It is the area enclosed by the whole boundary polygon, before the perimeter road setback and before any obstruction or terrain exclusion — so it does not fall as exclusions grow. Add an obstruction, tighten the slope limits or widen the perimeter road and the capacity drops while this row stays exactly where it was.
Piles counts half tables at full weight. The pattern is stamped onto every table regardless of width, so on a plant with half-table infill the count is optimistic. See Piles.
ARRAY
| Row | What it means | Reads — or 0 when |
|---|---|---|
| Full tables / Full trackers | Full MMS tables, or full tracker units, placed | Never |
| Half tables / Half trackers | Half units placed | 0 unless Add half tables / Add half trackers was on, or you placed them in Sketch Mode |
| Modules | Modules placed across the plant, full units plus half units | Never |
| Tilt (°) / Max tracking angle (°) | The fixed tilt the layout used, or the tracker's rotation limit — a tracker has no single tilt. May carry a * | Never |
| Pitch (m) | The row spacing the layout used. May carry a * | Never |
The first word of each row follows the mounting type; the position in the sheet does not move.
ELECTRICAL
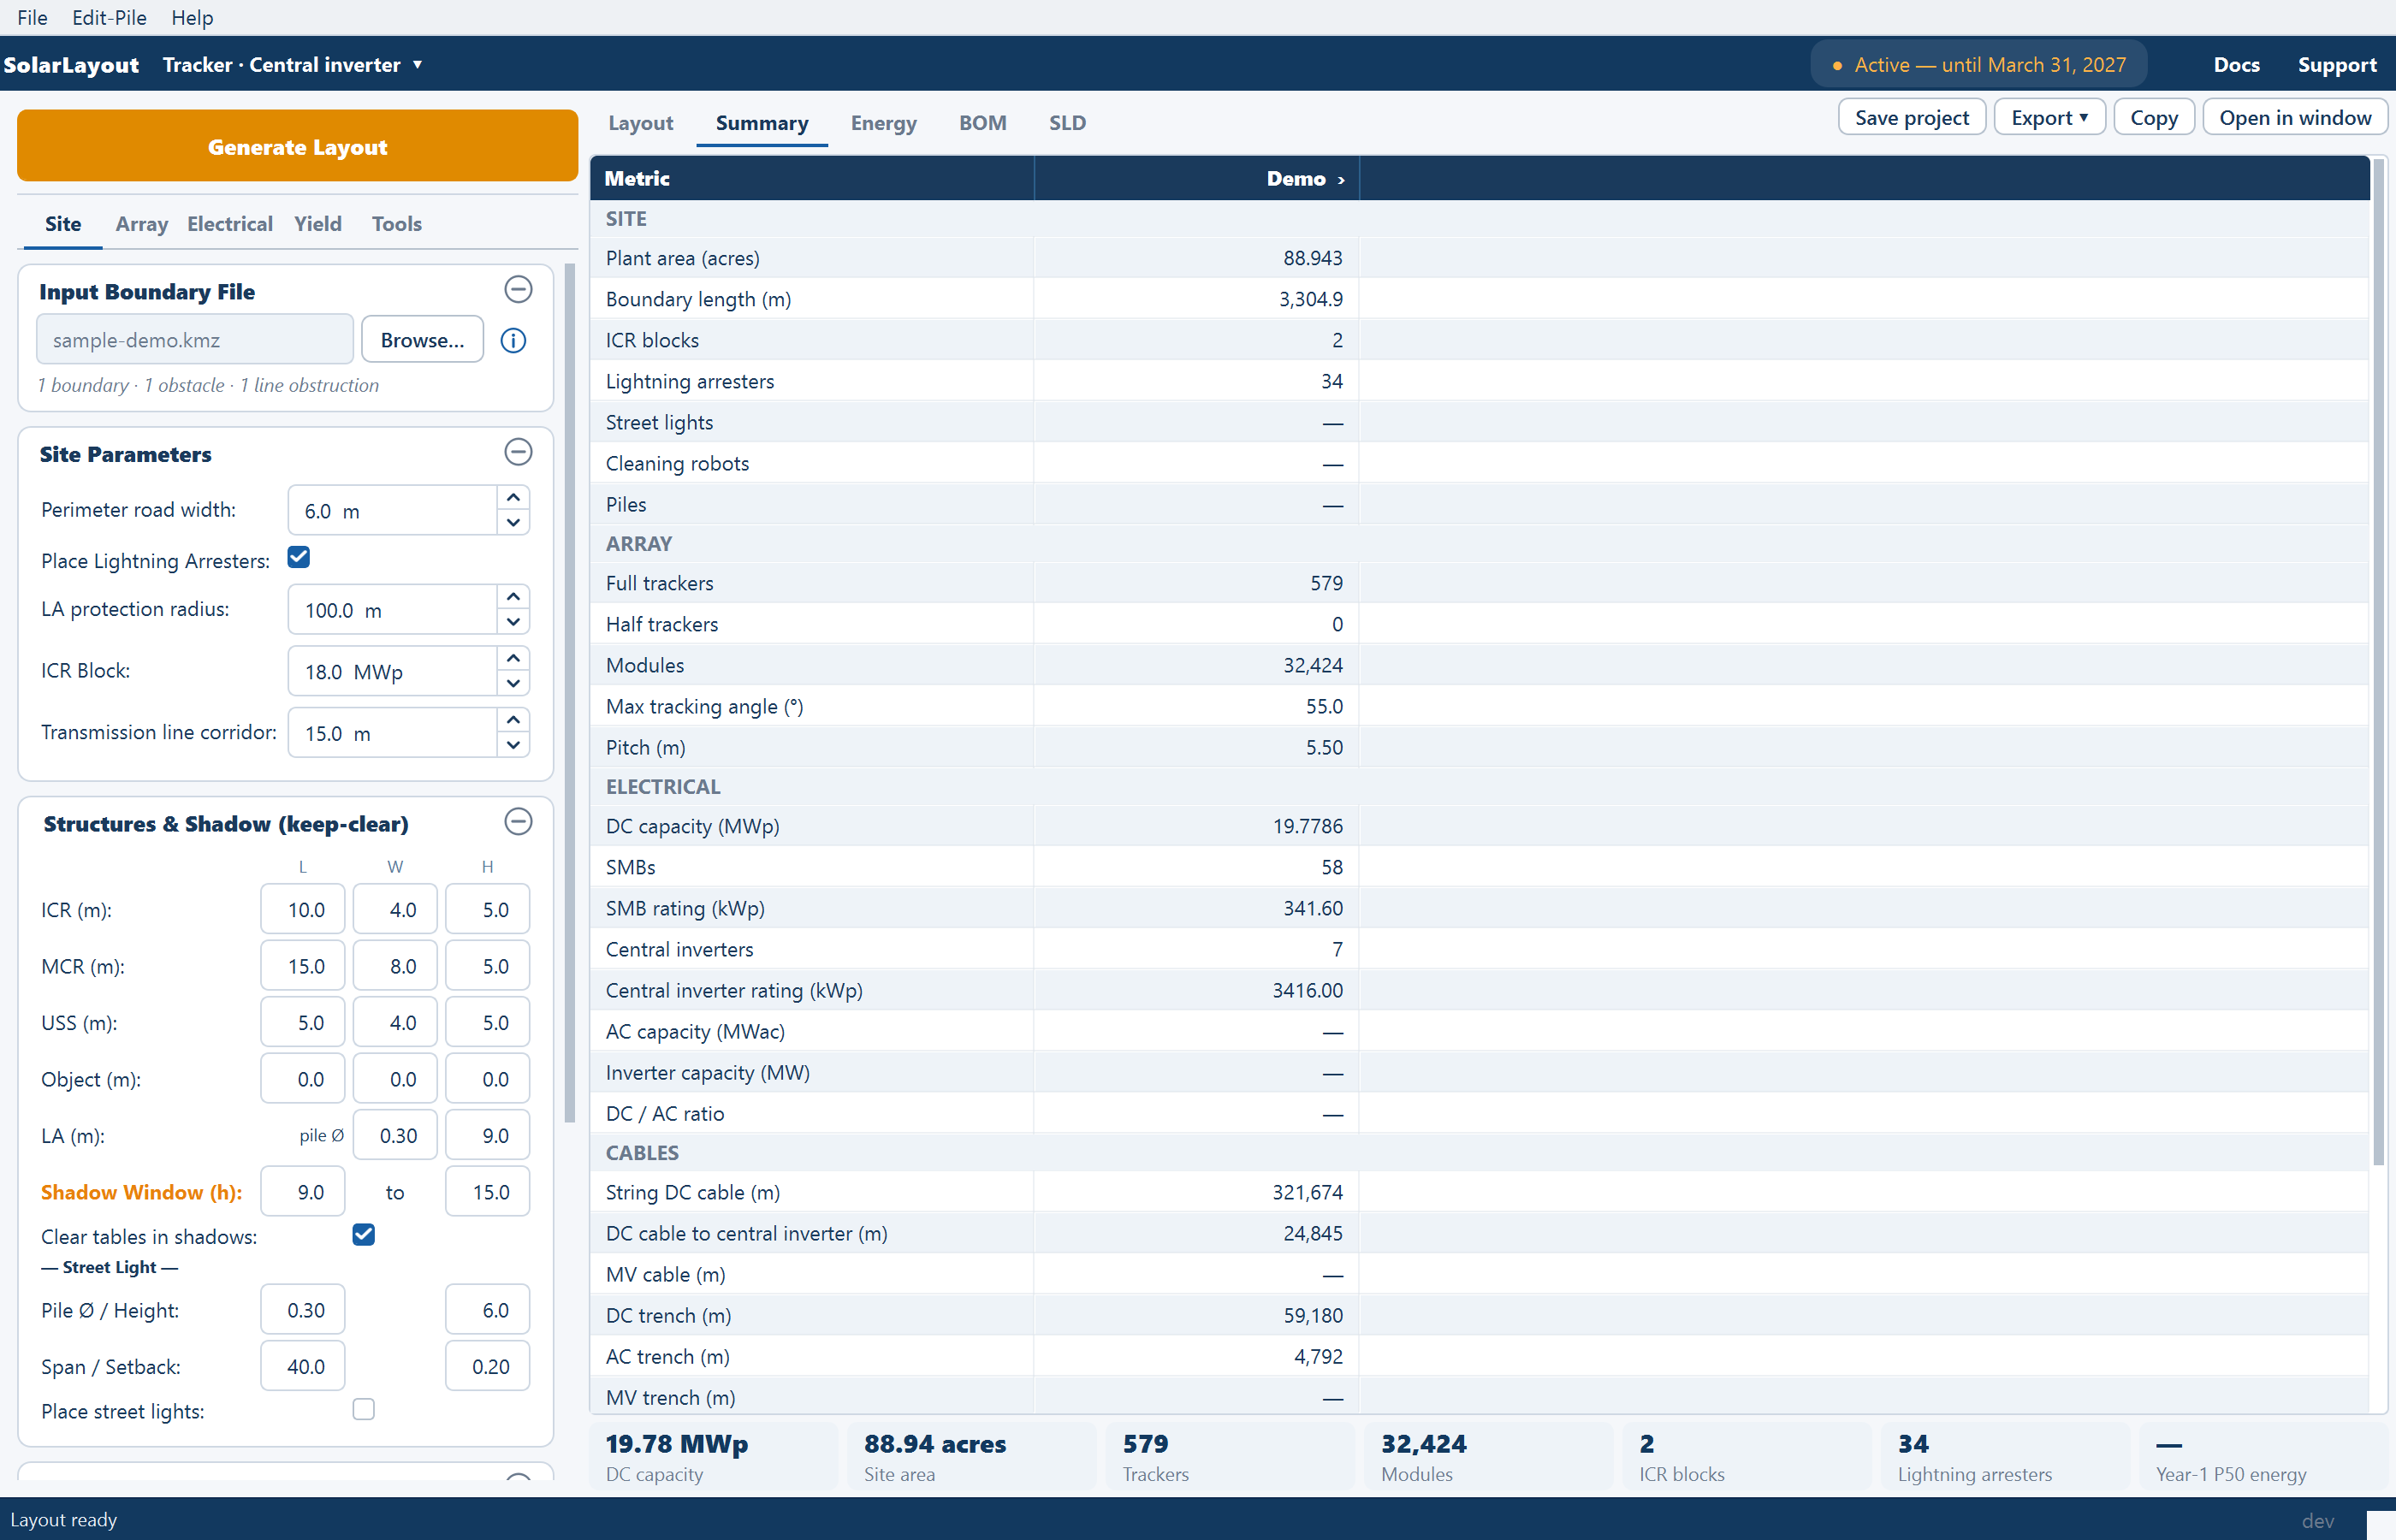
The inverter rows are a different set in each design, not the same rows relabelled. The last three rows are common to both.
| Row | What it means |
|---|---|
| DC capacity (MWp) | Plant DC capacity: the placed modules multiplied by the wattage |
| String inverters | String inverters placed |
| Inverter rating (kWp) | The DC capacity one string inverter carries |
| Row | What it means | Reads — when |
|---|---|---|
| AC capacity (MWac) | The AC capacity the plant is sized against, from the inverter file's PmaxOut (or Pnom) | No inverter file has been loaded |
| Inverter capacity (MW) | The installed inverter capacity | No inverter file has been loaded |
| DC / AC ratio | DC capacity divided by AC capacity. The design overload limit is 1.5 for string inverters and 1.4 for central inverters | No inverter file has been loaded |
Comparing a string design against a central design therefore means comparing different rows. Read DC capacity, ICR blocks and the CABLES group instead — those are common to both.
CABLES
Six rows in metres, answering two different questions. The first three are conductor to procure; the last three are trench to dig. Mixing them up over-orders cable or under-digs trench.
| Row | What it means | Reads — when |
|---|---|---|
| String DC cable (m) | Conductor from the tables to the string inverter or the SMB, counted twice for the positive and negative conductors | Calculate cables was off |
| AC cable to ICR (m) (string) / DC cable to central inverter (m) (central) | AC from each inverter to its nearest control room, counted once as a three-phase run — or the DC trunk from each box to the control room, counted twice. There is no AC leg in a central design, because the central inverter sits inside the building | Calculate cables was off |
| MV cable (m) | Medium-voltage conductor from the control rooms to the main control room | No MCR placed, or the layout not generated again with cables on since placing it |
| DC trench (m) | Trench length for the string DC cables | Calculate cables was off |
| AC trench (m) | Trench length for the second leg | Calculate cables was off |
| MV trench (m) | Trench length for the medium-voltage run | As MV cable (m) |
A trench total is the de-duplicated path length per cable type, so a stretch several cables share is counted once. The trench figures are therefore the smaller ones, and the gap widens as the plant grows, because more cables share each corridor near the control rooms; medium-voltage routes in particular merge nearby control rooms into one trunk. How each route is chosen is on Cable routing.
Because one second-leg figure is counted once and the other twice, the two are not comparable as a cable quantity even on the same plant.
Drawing an obstruction on the Tools tab re-places the inverters without re-measuring the cables: the two trench rows keep their figures but String DC cable (m) and the second-leg row read 0 until you generate again. Generate again before quoting cable lengths.
ENERGY
All five rows are empty until energy has been calculated. See How yield is calculated.
| Row | What it means |
|---|---|
| P50 energy, year 1 (MWh) | Year-one energy at the first exceedance probability |
| P75 energy, year 1 (MWh) | Year-one energy at the second exceedance probability |
| P90 energy, year 1 (MWh) | Year-one energy at the third exceedance probability |
| CUF (%) | Capacity utilisation factor: year-one energy divided by capacity in kWp × 8760 hours, as a percentage |
| P50 energy, 25 years (MWh) | The lifetime total — see below |
The three P rows are named from the exceedance probabilities you set, not fixed. On the shipped defaults of 50 %, 75 % and 90 % they read as above; change any of the three fields under Uncertainty & exceedance and the row name changes with it. Reading a sheet someone else produced, check the row names before quoting a number.
"P50 energy, 25 years" does not report 25 years. The figure is the cumulative energy over years 1 to Plant lifetime, after degradation, at the first exceedance probability — and the row name does not follow the lifetime setting. Plant lifetime ships at 30 years, so on shipped settings a row named "25 years" carries a 30-year total, and raising or lowering the lifetime moves the figure while the name stands still. Document it as the lifetime total.
Do not quote the lifetime row by its name. Read Plant lifetime and the first exceedance probability off the Yield tab and state both alongside the figure, or the number will be attributed to a period it was never computed over. How the figures are derived is on Lifetime and P-values.
Where the same figures appear elsewhere
The sheet is not the only place these numbers surface, and the other places carry a subset rather than a different calculation.
| Destination | What it carries |
|---|---|
| The plant chips under every view | DC capacity, site area, plants (multi-plot only), tables or trackers, modules, ICR blocks, lightning arresters (when placed) and year-one P50 energy. Water-body results are left out of the totals |
| The Yield tab's status line | After a run: PR, year-one energy, CUF and the lifetime total |
| The Word report | The Results & Analysis — Output section and the Design Summary annexure; the energy sections only when energy was calculated. See Project report |
| The cable schedule (Excel) | One sheet per ICR block: the DC strings and the AC or DC-trunk feeders, with recommended conductor sizes |
| The TMY data CSV | The GHI, in-plane irradiance and energy time series the ENERGY rows are built from, at the interval you choose. See Time series |
| The Google Earth file | A summary placemark per plant carrying capacity in MWp, area in acres, pitch and table count, plus an Overall Summary folder aggregating every boundary. See KMZ export |
| The bill of materials | Quantities computed from the same placed counts, including the cleaning fleet once you have asked for one. See Bill of materials |
Where to go next
Every parameter and its default
The complete input reference — every card on the five stage tabs, each field's shipped default, its accepted range, and what it changes.
Shortcuts and commands
Every keyboard shortcut, the typed command line in Sketch Mode, the ribbon, the tools row of each view, the Export menu, the SLD and BOM tools, and the full menu map.