CAD drawing boundaries
Using a DXF or DWG as the plant boundary, what the Site reference window asks for, and why the site latitude and longitude decide whether energy can be calculated.
A CAD drawing can be used as the boundary input: pick a .dxf or .dwg file
with Browse… on the Site tab and the application reads the site outline
from it, along with the closed shapes drawn inside that outline, which become
obstacles.
What a CAD drawing does not carry is a position on the earth. Its coordinates are drawing coordinates. That single gap is what this page is about, because it decides whether the design gets an energy estimate — and, less obviously, whether the automatic tilt and row pitch are right.
What is extracted
Only closed polylines are read — LWPOLYLINE and POLYLINE entities, and
only where the ring is closed. That is the whole of what the application looks
for, for the boundary and for the shapes inside it alike:
- The boundary — the largest closed polyline in the drawing.
- Interior obstacles — closed polylines fully inside that outline. Each is subtracted from the usable area, exactly as an obstruction polygon from a Google Earth file would be.
A circle, a spline, an arc, a hatch or a plain line is not read at all —
neither as the boundary nor as an obstacle. A site outline drawn as a spline or a
chain of lines is not found, and the application asks you to draw the boundary as
a closed LWPOLYLINE or POLYLINE. A pond drawn as a circle is not kept clear,
and nothing warns you: the layout simply covers it.
Convert everything you need read into a closed polyline before exporting, and check closure while you are there. Anything else in the drawing is ignored rather than misread, so dimensions, text, title blocks, hatching and layers do no harm and a busy drawing does not need cleaning up first.
Feature classification by name is not available for a CAD drawing. Names and layer names are not inspected, so a pond and a building are the same thing to the application: ground to keep clear. Water bodies cannot be distinguished, and so are not labelled, coloured or exported as water anywhere.
Two consequences worth planning around:
- Anything you want kept clear must be a closed polyline inside the boundary. An open outline is not subtracted from anything.
- Transmission line and canal corridors have to be added by hand after the layout is generated, because there is no line-plus-setback rule to apply. See Obstructions and exclusions.
If either of those matters on your site, trace the boundary into a Google Earth file instead — see Boundary file requirements for what that buys you.
A .dwg file needs the free ODA File Converter installed. Without it, save the
drawing as .dxf from your CAD program and load that.
The Site reference window
Choosing a .dxf or .dwg file opens the Site reference window. It has one
card, LOCATION, and a footer.
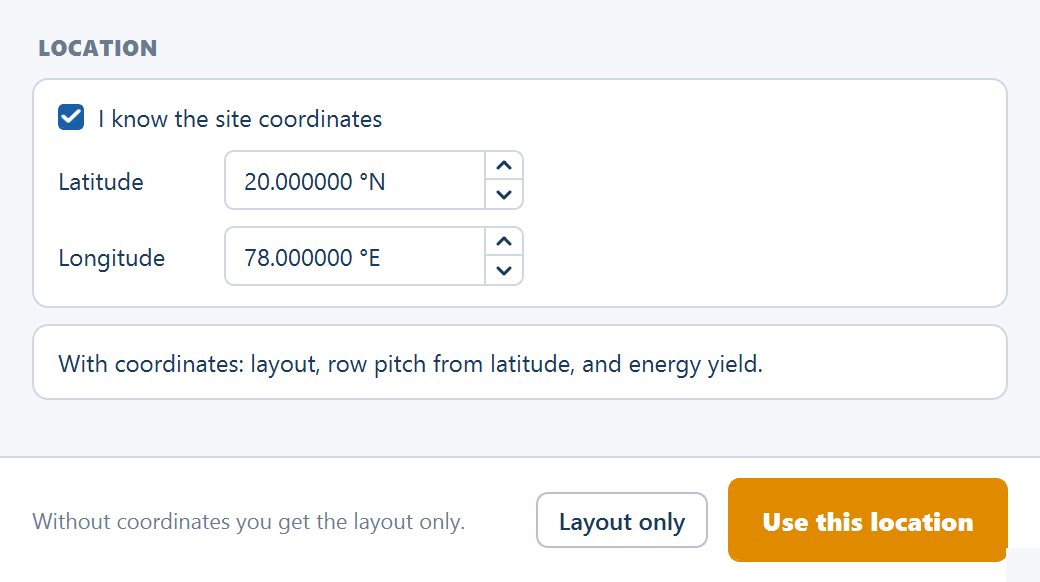
| Control | Default | Range | What it does |
|---|---|---|---|
| I know the site coordinates | ticked | — | Unticking it greys out the two fields and changes the primary button to Continue without coordinates |
| Latitude | 20.000000 °N | −90 to 90 | The site's latitude, in decimal degrees; north positive |
| Longitude | 78.000000 °E | −180 to 180 | The site's longitude, in decimal degrees; east positive |
A banner under the fields states the consequence of the choice as you make it: With coordinates: layout, row pitch from latitude, and energy yield. while the box is ticked, and Without coordinates: layout only. Energy yield is disabled. when it is not. The footer repeats the short form — Without coordinates you get the layout only. — beside two buttons:
| Button | What it does |
|---|---|
| Layout only | Loads the drawing without a position. Energy yield is disabled for this file |
| Use this location | Loads the drawing positioned at the latitude and longitude entered. Reads Continue without coordinates when the checkbox is unticked, and then does the same as Layout only |
Enter the coordinates. The best source is the same one you would use for any site record — a coordinate off the survey, or a point read from Google Earth at the centre of the site. What depends on the value is the sun's position and the weather record, not the geometry, so a centre-of-site coordinate is what the fields want rather than a surveyed monument.
What is lost without them
Energy calculation is unavailable. The layout is still generated — tables placed, control rooms sited, cables routed, quantities counted — and the whole plant appears in the Summary view, the CAD export and the report. But there is no yield, no capacity factor and no exceedance probability. Calculate Energy on the Yield tab is disabled, and its tooltip says why and tells you to load the file again with coordinates; the Energy view says the same in place of a result. No wrong energy figure is ever produced.
Skipping the coordinates does not stop the layout — it silently positions the site at a fallback of 20° N, 78° E, which is also what the two fields show before you touch them. The layout is generated normally, but the automatic tilt angle and row pitch are derived from that fallback latitude, not from your site. Nothing on screen flags it, because the figures look entirely reasonable. On a site far from that latitude they are wrong. Either load the file again with the coordinates, or tick both overrides in Spacing and tilt and enter the tilt angle and row pitch yourself.
| What needs the coordinates | Why |
|---|---|
| The automatic tilt angle | Tilt is derived from latitude. The application's rule of thumb is tilt ≈ latitude × 0.76 + 3.1°. |
| The automatic row pitch | Pitch is the spacing at which rows do not shade each other at solar noon on the winter solstice, which depends on the sun's elevation at that latitude. |
| The weather record | The irradiance and temperature series are fetched for a latitude and longitude. Without a point on the earth there is nothing to fetch. |
With both overrides set by hand you get a correct table count and a correct capacity. You still do not get an energy estimate — for that, supply the coordinates.
How the drawing is placed on the ground
Geo-referencing a CAD drawing distorts nothing. The drawing's own shape and area are preserved exactly:
- The centroid of the drawing is taken as its origin.
- The latitude and longitude you entered are converted to metres in the site's local UTM zone. That becomes the reference point.
- Every point in the drawing is treated as a metre offset from the drawing centroid, and that offset is added to the reference point.
So the drawing is translated onto the earth, not stretched onto it. A 400 m edge in the drawing is 400 m on the ground, an outline enclosing 120 acres still encloses 120 acres, and the site lands centred on the coordinate you gave.
Two things follow:
- The drawing must already be in metres. A drawing in millimetres or in feet is read as though those numbers were metres, and the plant comes out the wrong size. Check the area the application reports for the plant against the survey before going further.
- The coordinate you enter is the centre of the site, not a corner. Entering a corner coordinate shifts the whole plant by half its own width — which matters for the aerial imagery backdrop and for anything you compare against the real site, though not for the layout itself.
Loading a drawing
Pick the file with Browse…
On the Site tab, click Browse… on the Input Boundary File card and
choose the .dxf or .dwg. The Site reference window opens on its own
straight afterwards.
Enter the site latitude and longitude
Leave I know the site coordinates ticked, give the coordinate for the centre of the site, and click Use this location. Layout only is there for a quick geometric check, at the cost of the energy estimate and the automatic tilt and pitch.
Generate, then check the reported area
Read the Site area chip under the plot, or the Plant area (acres) row of the Summary view, and compare it against the survey. It is the gross boundary area before the perimeter road is taken off, so it should match the survey directly. A drawing in millimetres comes out a thousand times too large in each direction; a drawing in feet a little over three times too large. Fix the units in the CAD program and load the file again.
Add the exclusions the drawing could not carry
Water bodies, transmission line corridors and anything else that needs keeping clear goes on by hand, in Sketch Mode.
Contour files are a separate input
A DXF can also be supplied as contour data in Topography, which is an entirely different input from the boundary. A contour file must already be in the project's UTM coordinates, whereas a boundary drawing is positioned by the latitude and longitude you type in. Do not use the same file for both purposes unless it genuinely is both.
Where to go next
Boundary file requirements
How to draw and name the features in a Google Earth file so the application reads the boundary, water bodies, obstructions and transmission lines correctly.
Image boundaries
Tracing a plant boundary from a scan, a screenshot or an exported picture, and setting the scale in the Site reference window that turns pixels into metres.